212 results
Statistics centers for Google Apps
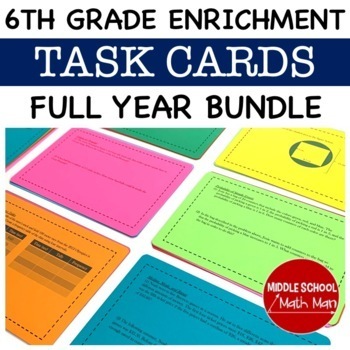
6th Grade Math Task Cards | Math Enrichment Task Card Activities Bundle
These 6th grade math task card activities include 87 different challenging task cards to use as review, enrichment, math centers, or with early finishers. The task cards are designed specifically for 6th grade math topics. Concepts include geometry, algebra, numbers and operations, statistics, and other standards listed below. All task cards include a digital Google slides and printable option.Save 40% and get the majority of my math products, including this resource, at a large discount by purc
Subjects:
Grades:
5th - 8th
Types:
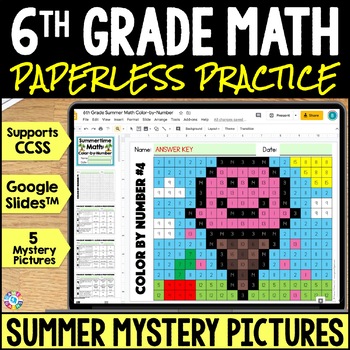
End of the Year Math Fun Activity 6th Grade Review Summer Mystery Picture Slides
Looking for a fun activity for 6th grade math review at the end of the year? With these 6th Grade Math Summer Mystery Pictures for Google Slides™, your students will practice ratios & proportions, number system, expressions & equations, statistics & probability, and geometry standards. Students will love using Google Slides™ to "color" and reveal summer-themed mystery pictures. These digital summer math review activities are fun to use during the final weeks of school or even during
Subjects:
Grades:
6th
Types:
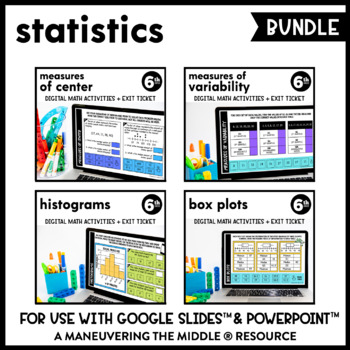
Statistics Digital Math Activity Bundle | Measures of Center | Google Slides
These supplemental digital math activities can be used to support data and statistics concepts. They are interactive (drag and match, using the typing tool, using the shape tool) and paperless through Google Slides™ and PowerPoint™. Topics Included:Measures of Center (4 interactive slides + exit ticket)Measures of Variability (4 interactive slides + exit ticket)Histograms (4 interactive slides + exit ticket)Box Plots (4 interactive slides + exit ticket)What is included?1. Paperless Math Activit
Subjects:
Grades:
6th
Types:
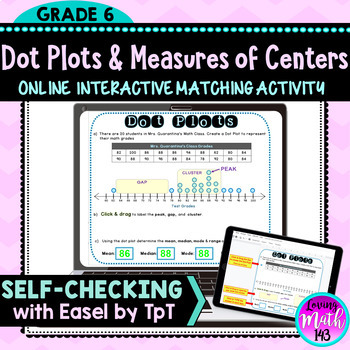
Dot Plots and Measures of Center Digital Activity for Distance Learning
Dot Plots & Measures of Center Interactive Activity for Distance LearningStudents will create a Dot Plot / Line Plot for a data set with 20 values. Students will identify the cluster, peak, and gap located on the Dot Plot. Students will also find the mean, median, mode, and range for the data set. it is a perfect resource for distance learning and students using Google Classroom™. This activity is interactive. Students will click and drag to move the dots to create the dot plot. In addition
Subjects:
Grades:
6th
Types:
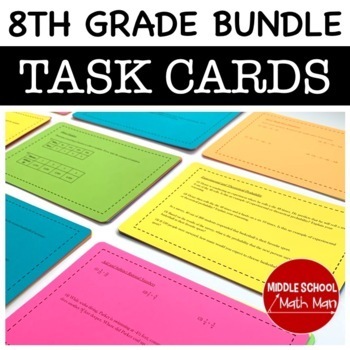
8th Grade Math Task Cards Full Year Bundle
This set of 8th grade math task cards includes the 12 different math units shown below. It consists of 1-4 math problems for each of the following topics, including different algebra, geometry, numbers and operations, probability, and statistics concepts. A total of 276 problems and an answer key IS included! The task cards include a digital Google slides and printable option.To see a free sample of the type of problems included, you can download the following free unit of task cards.8th Grade M
Subjects:
Grades:
7th - 8th
Types:
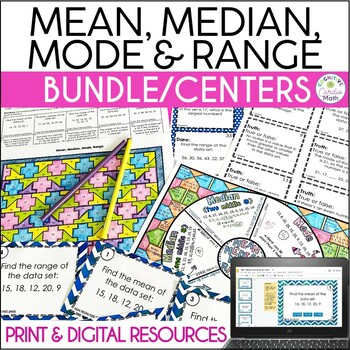
Mean, Median, Mode, Range Activity Bundle Math Centers
Use these mean, median, mode and range resources for your upper elementary or middle school math centers, homework, or independent practice! Some print and some digital.There are both group and independent activities to keep your students active and engaged.The resources include Truth or Dare game, Color by Number, Footloose Task Cards, and Math Wheel for taking notes.In these mean, median, mode, range resources, problems require students to:Find mean, median, mode or range of data setsFind a mi
Subjects:
Grades:
5th - 6th
Types:
Data Analysis and Statistics in Algebra 1 Google Forms Homework and Assessment
This Algebra 1 Google Forms bundle currently includes auto-grading assignments on the following skills related to data analysis and statistics:Measures of Central TendencyDot Plots and HistogramsBox PlotsStandard Deviation and The Empirical RuleTwo-Way Frequency TablesScatter PlotsEach assignment also includes a PDF "worksheet" for students to complete along with the form.All of the assignments in this bundle are also included in my:★ Algebra 1 (Semester 2) Google Forms BundleYou may also be int
Subjects:
Grades:
6th - 9th
CCSS:
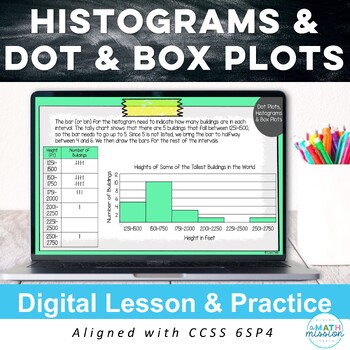
Statistics Histograms Box Plots Dot Plots Digital Math Lesson 6SP4 Activity
Save yourself time with this editable, digital math resource! Included is the lesson and practice for displaying numerical data on histograms, box and whisker plots, and dot plots. This digital activity guides students through the 6.SP.4 standard. Informational lesson pages are intertwined with interactive learning activity slides. Students drag or type in answers on the Google Slides. Great alternative to worksheets! These can be used in so many ways: math centers, stations, extra practice, as
Subjects:
Grades:
6th - 7th
CCSS:
Statistics Describing Data Distribution Digital Lesson & Practice 6SP2 Activity
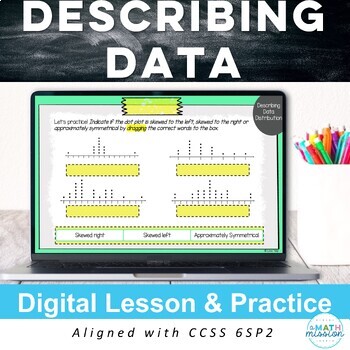
Save yourself time with this editable, digital math resource! Included is the lesson and practice for describing distribution of data using dot plots and histogram to identify gaps, peaks, range, outliers, skewed left & skewed right, and how to read a box plot. This digital activity guides students through the 6.SP.2 standard. Informational lesson pages are intertwined with interactive learning activity slides. Students drag or type in answers on the Google Slides. Great alternative to works
Subjects:
Grades:
6th - 7th
CCSS:
Box and Whisker Plot Practice | Printable & Digital | 5 Number Summary
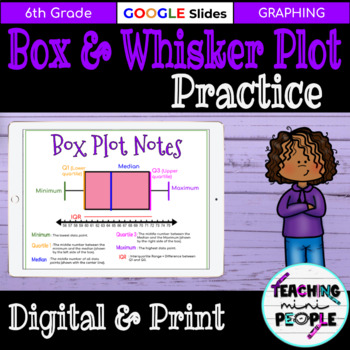
This Box Plots practice is perfect for distance learning or in class math center review with Five Number Summary and plotting the data. There is a page of notes that are color coded for the Five Number Summary. Then two sets of questions that go with two data sets. The first set of data has 10 data points so students have to practice finding the median of an even data set. The second set has 9 data points so students can practice finding the Q1 and Q3 using the mean of the two. In total, there
Subjects:
Grades:
6th
Types:
CCSS:
Two-Way Tables - Frequency Tables for Google Slides™
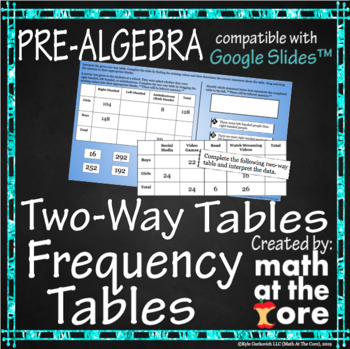
- Great for online and distance learning! Created to be compatible with Google Slides™!- In this digital activity, students will construct and interpret two-way frequency tables.- This activity includes 31 different problems involving two-way frequency tables. Students will start with determining which statements about a given frequency table are true and which are false. They will then have to analyze the table and fill in the missing blanks to make the table correct and complete. The problems
Subjects:
Grades:
7th - 8th
Types:
CCSS:
Also included in: Statistics - Unit 7 - BUNDLE for Google Slides™
Finding Mean, Median, Mode, and Range Game | Math Activity
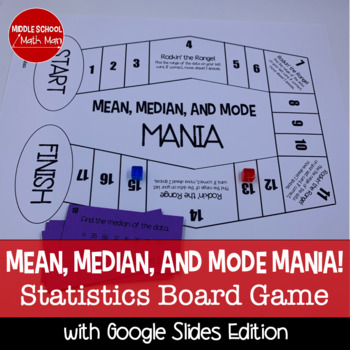
Mean, Median, and Mode Mania is a math board game that helps students practice finding the mean, median, mode, and range of data. This resource includes a printed and digital version. Students must find the mean, median, or mode of different sets of numbers to help them move around the game board. Landing on a "Rockin' the Range" space gives the student a chance to move ahead by finding the range of the numbers on their card.You can get this resource and many of my other 6th grade resources as a
Subjects:
Grades:
5th - 6th
Also included in: Math Mega Bundle (For Upper Elementary/Middle School Math) PART 2
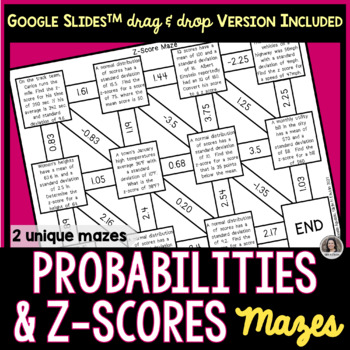
Z Scores and Probabilities of Normal Distributions Mazes Google Slides™ & Print
Make practicing math more fun with these 2 different mazes on finding z-scores and probabilities of normal distributions. For each self correcting maze activity, students will solve at least 9 problems. Types of Mazes*Finding Z-Score from a Word Problem Maze #1*Finding Probabilities or X-Values Given the Z-Score Maze #2Students may complete their work on the provided student response sheet that corresponds to the maze assigned. Note: Not all boxes are used. Included:TWO unique MazesA pdf with a
Subjects:
Grades:
6th - 12th, Higher Education
Types:
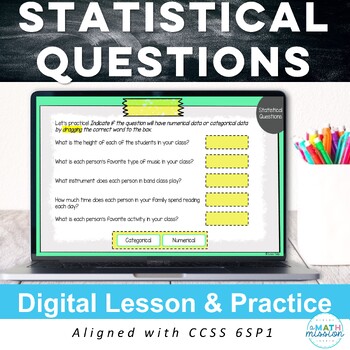
Statistical Questions Digital Math Lesson and Practice 6SP1 Activity 6th grade
Save yourself time with this editable, digital math resource! Included is the lesson and practice for statistical questions, and categorical & numerical data. This digital activity guides students through the 6.SP.1 standard. Informational lesson pages are intertwined with interactive learning activity slides. Students drag or type in answers on the Google Slides. Great alternative to worksheets! These can be used in so many ways: math centers, stations, extra practice, as a teacher guided l
Subjects:
Grades:
6th - 7th
CCSS:
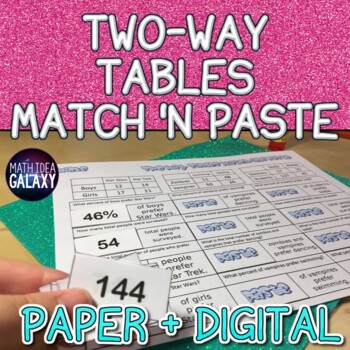
Two Way Tables Match and Paste Activity with Digital Version
This activity gets students doing more than a worksheet as they match possible answers with questions about two way tables. This is an excellent way to practice with partners and in an interactive manner. Students will use three different tables to answer 4 questions about each of them.This matching activity comes in both printable AND digital formats. The digital format is built in Google Slides to easily assign to students. This resources includes:-1 Match and Paste Activity (Printable)-Digita
Subjects:
Grades:
6th - 8th
Types:
CCSS:
Also included in: Two Way Tables Activities Bundle
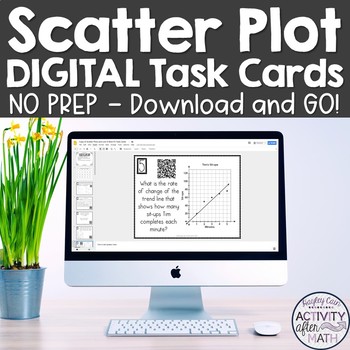
Scatter Plots Line of Best Fit Digital Task Cards Distance Learning
GOOGLE Slide Version Get your students involved with practicing Interpreting Data with Scatter Plots and Line of Best Fit! Task cards include multiple choice problems and constructed response. This is a great activity that can be used for distance learning and review in math centers, as individual work, or as a group activity! This integrates the use of technology into the classroom by allowing students to use their phone, tablets, laptops, and desktops to view the task card and by being able to
Subjects:
Grades:
8th - 9th
Types:
Also included in: 8th Grade Math DIGITAL TASK CARDS BUNDLE Google Slides
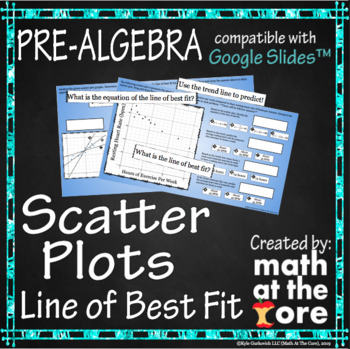
Scatter Plots - Line of Best Fit for Google Slides™
- Great for online and distance learning! Created to be compatible with Google Slides™!- In this digital activity, students will analyze scatter plots and determine the line of best fit. They will use the line of best fit and the equation of that line to predict values. They should be familiar with writing the equation of a line.- This activity includes 20 different problems involving analyzing scatter plots. Students will start with determining which line is the line of best fit for the given s
Subjects:
Grades:
7th - 9th
Types:
Also included in: Statistics - Unit 7 - BUNDLE for Google Slides™
Digital Random Sampling and Populations Activities for Google Classroom
These digital math station activities are intended to help students understand how to recognize proportional relationships, understand that statistics can be used to gain information about populations by examining a sample group, and use data from a random sample to draw inferences and generate multiple samples to gauge variation in predictions.DIGITAL RANDOM SAMPLING & POPULATIONS FEATURES: 6 different digital math activities to engage students. Students can complete independently and submi
Subjects:
Grades:
7th
Types:
Also included in: Digital Math Activities for Google Classroom 7th grade BUNDLE
Probability ESCAPE ROOM 7th Grade
This breakout escape room is an engaging way for students to practice their skills to determine and predict probability. Students use decoder puzzles to turn their answers into codes and advance level by level to break out of the game.TOPICS:Simple ProbabilityComparing ProbabilitiesMaking PredictionsCompound EventsImportant: Please view the Video Preview (found within the thumbnails above) for an explanation on how to decode the levels.Contents: ♦ Teacher Instructions ♦ 20 Mult
Subjects:
Grades:
6th - 8th
Types:
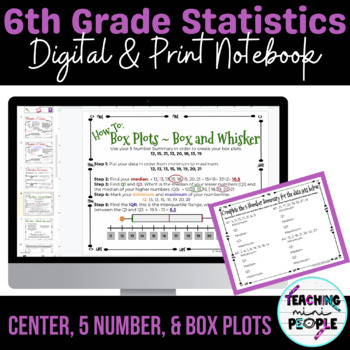
6th Grade Statistics | Box Plots | 5 Number Measure of Center
This 6th Grade Statistics Notebook is perfect for digital or print practice! Students will learn all about the measure of center (mean, median, and ode), 5 number summaries (Minimum, First Quartile, Median, 3rd Quartile and Maximum), and how to use box plots (box and whisker plots) with this 6th Grade Statistics Notebook. This 6th Grade Statistics Notebook includes a PDF which will include teacher directions, a printable version, the answer keys and the link for your copy of the digital version
Subjects:
Grades:
5th - 7th
Also included in: 6th Grade Statistics | Measure of Center | Box Plots | 5 Number Summary
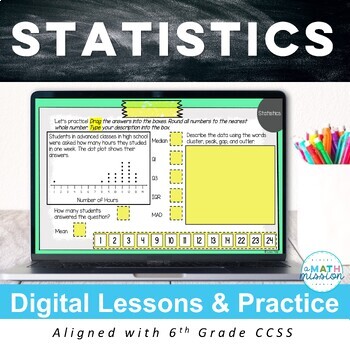
Statistics Unit Digital Lessons & Practice Activities for use with Google™
Engage your students and save yourself time with these distance learning lessons. These digital activities guide students through all the 6th grade common core statistics & probability standards. Informational lesson pages are intertwined with interactive learning activity slides. Students drag and drop or type in answers on the Google Slides. Great alternative to worksheets! These can be used in so many ways: math centers, stations, extra practice, as a teacher guided lesson or for students
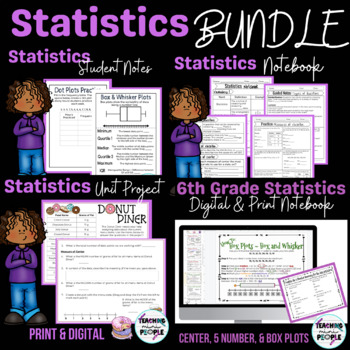
6th Grade Statistics | Measure of Center | Box Plots | 5 Number Summary
This Statistics Bundle is perfect for 6th graders who are learning about statistics. There are notes for you to teach your lesson with (anchor charts), a notebook set with guided practice and practice problems for each topic, vocabulary for each topic, digital or print practice with measure of center and box plots, and a unit project for the end to wrap it up. The digital notebook was recently added, by request! Statistics Notebook/Worksheets Include:➜ Statistics Vocabulary➜ Statistical Question
Subjects:
Grades:
5th - 7th
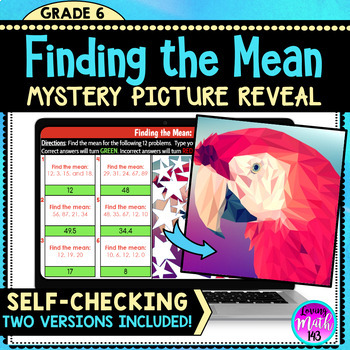
Finding the Mean: Digital Mystery Picture Art Reveal for Distance Learning
Middle school math students will practice calculating the measure of center (mean) using this fun and engaging Digital Self-Checking Mystery Picture reveal Activity! This engaging activity is a DIFFERENTIATED with two versions! >> Provide your struggling students with version one. (Fluency Practice)>> Provide your higher leveled students with version two. (Word Problems included)This is a perfect activity to check for understanding of probability and statistics during distance lear
Subjects:
Grades:
6th - 7th
Types:
Also included in: 6th Grade Math Mystery Activities for the whole Year! {MEGA BUNDLE}
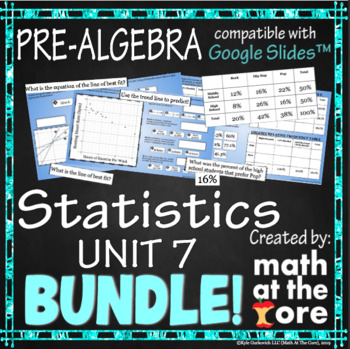
Statistics - Unit 7 - BUNDLE for Google Slides™
- Great for online and distance learning! Created to be compatible with Google Slides™!-In this interactive unit, students will interpret scatter plots. They should be able to determine what type of correlation a situation has whether it is by graph or through words. They should be able to identify clusters and outliers. students will analyze scatter plots and determine the line of best fit. They will use the line of best fit and the equation of that line to predict values. They should also be a
Subjects:
Grades:
7th - 8th
Types:
Showing 1-24 of 212 results


