59 results
Statistics independent work packets for Google Apps
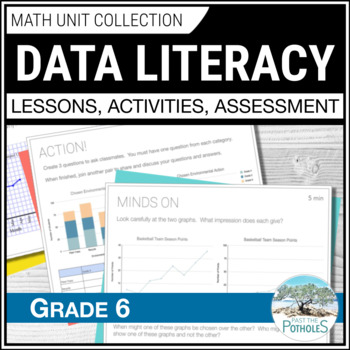
Data Management Unit: Reading Graphs Collecting & Analyzing Data Grade 6 Ontario
Save time and reduce stress!! This UPDATED Grade 6 Ontario Math Data Literacy unit has EVERYTHING YOU NEED. Students will learn about reading graphs, collecting data, analyzing data, misleading graphs, averages, and more. It includes 3-part Google Slides lessons, worksheets, games, centres, assessments, and report card comments. New histograms, broken-line graphs and infographic content are included with data analysis and data collection! SPECIFIC LESSON TOPICS:✓ Discrete and Continuous Data✓
Subjects:
Grades:
5th - 7th
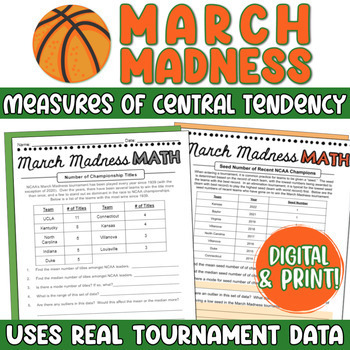
March Madness Math Mean, Median, Mode - Measures of Central Tendency Activity
This March Madness math activity asks students to determine mean, median, mode, and range for a variety of actual statistics from previous NCAA March Madness basketball tournaments. Perfect to excite any sports enthusiasts! It includes both print and digital formats, perfect for Google Classroom.Each page slide within the activity is dedicated to a different statistic (for example, years since previous championships amongst winners, regular season wins amongst Elite 8 teams, Seeds of Champions
Subjects:
Grades:
6th - 8th
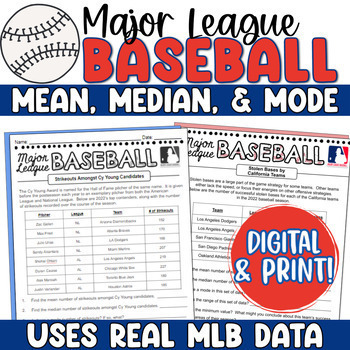
Baseball Math Mean, Median, Mode - MLB Baseball Measures of Central Tendency
This real-world baseball math statistics project asks students to determine mean, median, mode, and range for a variety of actual statistics from the 2023 Major League Baseball season. Perfect to excite any sports enthusiasts! It includes both a traditional print option and a digital version, made for Google for any 1:1 classrooms!Each slide within the activity is dedicated to a different statistic (for example, strikeouts amongst Cy Young candidates, or homeruns amongst MVP candidates). Stud
Subjects:
Grades:
6th - 9th
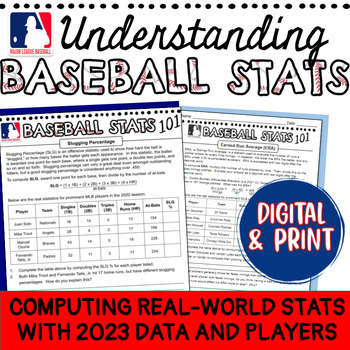
Understanding Baseball Stats MLB Math Sports Statistics Activity Digital & Print
This math baseball statistics activity is perfect for engaging your sports enthusiasts! It includes a Google Slides activity in which students explore and compute different baseball statistics using real numbers from the 2023 season, as well as the traditional print version. Students will enjoy seeing players they know and the real-life stats, and the higher order thinking questions will have them making connections in no time!This activity is great for enrichment, during baseball season, or fo
Subjects:
Grades:
7th - 10th
Types:
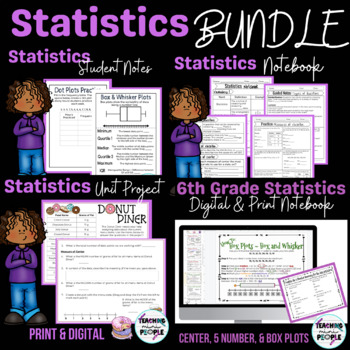
6th Grade Statistics | Measure of Center | Box Plots | 5 Number Summary
This Statistics Bundle is perfect for 6th graders who are learning about statistics. There are notes for you to teach your lesson with (anchor charts), a notebook set with guided practice and practice problems for each topic, vocabulary for each topic, digital or print practice with measure of center and box plots, and a unit project for the end to wrap it up. The digital notebook was recently added, by request! Statistics Notebook/Worksheets Include:➜ Statistics Vocabulary➜ Statistical Question
Subjects:
Grades:
5th - 7th
Mean as a Balance Point for Google Classroom
This resource was designed for distance learning! It is completely editable and is so easy to assign in Google Classroom. This resource reviews the concept of mean and introduces the process of using a frequency line graph to calculate balance point. Be sure to make a copy for each student when assigning in Google Classroom!
Subjects:
Grades:
4th - 7th
Tree Diagrams and The Fundamental Counting Principle for Distance Learning
This probability resource was created for distance learning! This resource gives students the opportunity to practice creating probability tree diagrams virtually. Notes and an example scenario are given before students work through 3 additional scenarios on their own. This resource is ready to use and requires no prep! It is so easy to assign in Google Classroom!
Subjects:
Grades:
4th - 7th
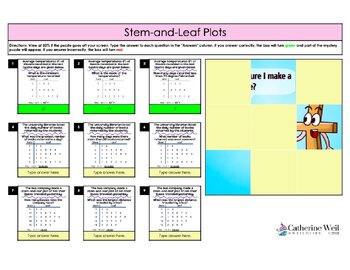
Math Mystery Puzzles: Data Displays
This self-correcting mystery puzzle is in Google Sheets. As students enter the correct answers the picture reveals itself. Box is red if the answer is wrong and green if the answer is correct - along with a puzzle piece reveal.This puzzle is an extension to Ch 10: Data Displays, Notes and Homeworkand Ch 10: Data Displays, Skill Check*Fun and engaging*Great for review*Self-correcting*Thank you LindsayBowden.com for the template!*You May Also Be Interested In:6th Grade Big Ideas, Notes and Homewor
Subjects:
Grades:
5th - 7th
Types:

Science Fair Weekly Assignment Packet
Do you struggle to help your students pace themselves through science fair projects? This packet helps to break the process down into manageable steps for students, and allows you weekly touch points with students to ensure their success. There is an overview of each assignment, and then space for the student to respond. I provide this packet to my students both on paper and via our LMS so they can always access what they need to do each week. This packet walks students through the independe
Subjects:
Grades:
5th - 8th

Statistics & Probability
Two documents include questions and related vocabulary terms. The other two documents are the related answer keys.
Subjects:
Grades:
10th - 12th, Higher Education
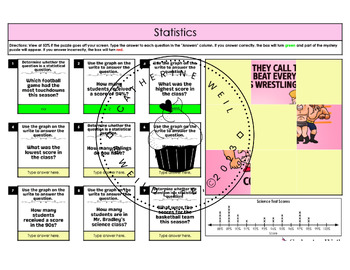
Math Mystery Puzzles: Statistical Measures
This self-correcting mystery puzzle is in Google Sheets. As students enter the correct answers the picture reveals itself. Box is red if the answer is wrong and green if the answer is correct - along with a puzzle piece reveal.This puzzle is an extension to Ch 9: Statistical Measures, Notes and Homeworkand Ch 9: Statistical Measures, Skill Check*Fun and engaging*Great for review*Self-correcting*Thank you LindsayBowden.com for the template!*You May Also Be Interested In:6th Grade Big Ideas, Notes
Subjects:
Grades:
5th - 7th
Types:
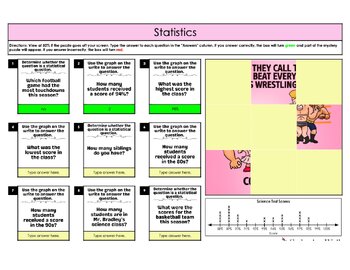
Math Mystery Puzzle: Introduction to Statistics
This self-correcting mystery puzzle is in Google Sheets. As students enter the correct answers the picture reveals itself. Box is red if the answer is wrong and green if the answer is correct - along with a puzzle piece reveal.This puzzle is an extension to Ch 9: Statistical Measures, Notes and Homework; Section 9.1: Introduction to Statistics and Ch 9: Statistical Measures, Skill Check*Fun and engaging*Great for review*Self-correcting*Thank you LindsayBowden.com for the template!*You May Also B
Subjects:
Grades:
5th - 7th
Types:
Also included in: Math Mystery Puzzles: Statistical Measures
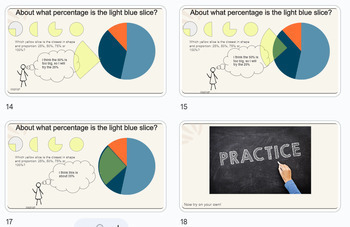
Estimating Percentages 2: Circle Graphs
This mathematics Slide Deck resource is intended to support learners working on Virginia Standard of Learning:6.NS.1 a)Estimate and determine the percent represented by a given model (e.g., number line, picture, verbal description), including percents greater than 100% and less than 1%. This material was development for 1:1 review and tutoring. Teachers may find it useful for younger learners and students receiving special/exceptional education as well as with students learning in states other
Subjects:
Grades:
3rd - 6th
CCSS:
Dot Plot Practice (Google Slides)
Dot (Line) Plot Practice via Google Slides- 100% digital resource- Answer key included- Students create dot plots from given data sets- Students interpret dot plots- Students evaluate the mean, median, mode, & range of dot plots
Subjects:
Grades:
5th - 8th
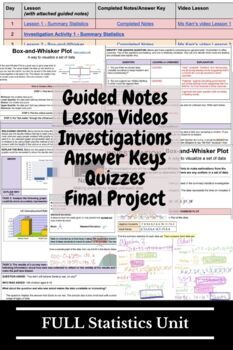
Statistical Analysis UNIT
This 6 lesson unit was designed for a distance learning or hybrid model classroom. There 4 video lessons on finding summary statistics, box-and-whisker plots, normal distributions, and using technology. There are also included investigation activities for students with clear and concise directions so they can go investigate further applications and properties of the mathematics presented in the lessons. The last 2 lessons focus on applications of misleading statistics and possible bias in sampli
Subjects:
Grades:
9th - 12th
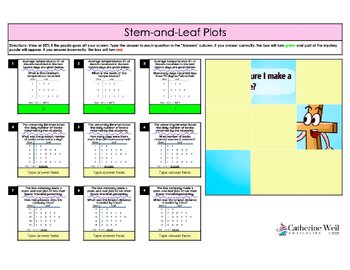
Math Mystery Puzzle: Stem-and-Leaf Plots
This self-correcting mystery puzzle is in Google Sheets. As students enter the correct answers the picture reveals itself. Box is red if the answer is wrong and green if the answer is correct - along with a puzzle piece reveal.This puzzle is an extension to Ch 10: Data Displays, Notes and Homework; Section 10.1: Stem and Leaf Plots and Ch 10: Data Displays, Skill Check*Fun and engaging*Great for review*Self-correcting*Thank you LindsayBowden.com for the template!*You May Also Be Interested In:6t
Subjects:
Grades:
5th - 7th
Types:
Also included in: Math Mystery Puzzles: Data Displays
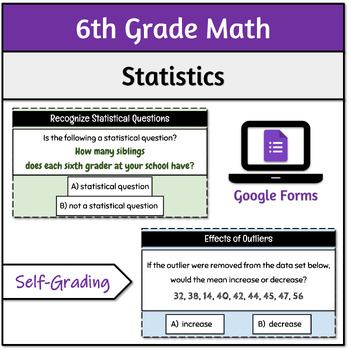
Statistics | 6th Grade Math | Self-Grading Google Forms™
This sixth grade digital math resource includes Google Forms with questions on Statistics. This self-grading resource can be used as a worksheet to assess your students understanding, and provide them with the practice they need.✅ Statistics:Develop understanding of statistical variability.Skills included in this resource ⬇️Recognize Statistical QuestionsMeasures of CenterEffects of OutliersMean Absolute Deviation
Subjects:
Grades:
6th

Scatter Plots, Income Inequality, and The Gatsby Curve
This bundle includes a student copy and Teacher Guide/answer key.In this three-part activity, students are introduced to two statistics used to describe economies: the Gini Coefficient (measuring income inequality) and Intergenerational Earnings Elasticity (IEE, measuring social mobility from generation to generation.) The activity revolves around scatter plots of Gini Coefficient vs. IEE.In part 1, focusing on placing/locating points on a scatter plot, students match verbal descriptions of fict
Subjects:
Grades:
9th - 12th
CCSS:

Using Desmos to find statistics, make graphs, and linear regression - self guide
This is a digital resource that guides students through finding statistics (mean, median), making graphs (histograms, dotplots, boxplots, and scatterplots) and writing the equation of the line of best fit using Desmos.
Subjects:
Grades:
8th - 9th
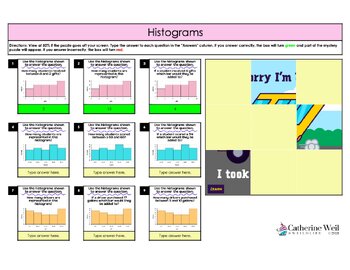
Math Mystery Puzzle: Histograms
This self-correcting mystery puzzle is in Google Sheets. As students enter the correct answers the picture reveals itself. Box is red if the answer is wrong and green if the answer is correct - along with a puzzle piece reveal.This puzzle is an extension to Ch 10: Data Displays, Notes and Homework; Section 10.2: Histograms and Ch 10: Data Displays, Skill Check*Fun and engaging*Great for review*Self-correcting*Thank you LindsayBowden.com for the template!*You May Also Be Interested In:6th Grade B
Subjects:
Grades:
5th - 7th
Types:
Also included in: Math Mystery Puzzles: Data Displays
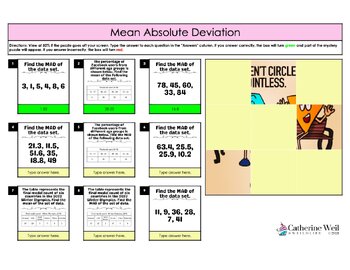
Math Mystery Puzzle: Mean Absolute Deviation
This self-correcting mystery puzzle is in Google Sheets. As students enter the correct answers the picture reveals itself. Box is red if the answer is wrong and green if the answer is correct - along with a puzzle piece reveal.This puzzle is an extension to Ch 9: Statistical Measures, Notes and Homework; Section 9.5: Mean Absolute Deviation and Ch 9: Statistical Measures, Skill Check*Fun and engaging*Great for review*Self-correcting*Thank you LindsayBowden.com for the template!*You May Also Be I
Subjects:
Grades:
5th - 7th
Types:
Also included in: Math Mystery Puzzles: Statistical Measures
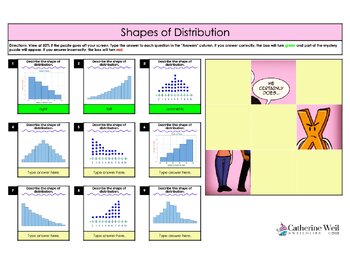
Math Mystery Puzzle: Shapes of Distribution
This self-correcting mystery puzzle is in Google Sheets. As students enter the correct answers the picture reveals itself. Box is red if the answer is wrong and green if the answer is correct - along with a puzzle piece reveal.This puzzle is an extension to Ch 10: Data Displays, Notes and Homework; Section 10.3: Shapes of Distribution and Ch 10: Data Displays, Skill Check*Fun and engaging*Great for review*Self-correcting*Thank you LindsayBowden.com for the template!*You May Also Be Interested In
Subjects:
Grades:
5th - 7th
Types:
Also included in: Math Mystery Puzzles: Data Displays
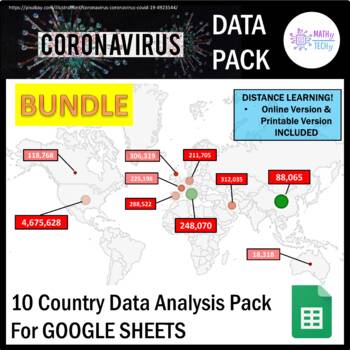
Coronavirus Data Analysis Packet - 10 COUNTRY BUNDLE (Distance Learning)
Distance Learning with a purpose! Have students dig into the real world COVID-19 Pandemic data. This data analysis packet is ideal for GOOGLE CLASSROOM and also comes with PRINTABLE VERSIONS. The product comes with COVID-19 data for 10 COUNTRIES and includes: Country Data Analysis Packs included in this BUNDLE:United States, China, Italy, Canada, Australia, United Kingdom, France, Germany, Spain, IranONLINE VERSION:Google Sheets spreadsheet with real data for"New Cases", "New Deaths", "Popula
Subjects:
Grades:
Not Grade Specific

Sports Statistics - Explore Statistics through sports
Activity that gets students thinking about statistics and the context needed to fully understand them."Fill out the following worksheet / activity based around sports statistics. You are going to choose any 1 sports statistics (completion percentage, 3pt percentage, ERA, batting average, xG, pressures per 90, record, etc.) and answer questions about it. It can be a “good” statistic to have or a “bad” one."For example Jerry West has NEVER shot a 3 pointer. Why? 3 point line was not in the game at
Subjects:
Grades:
6th - 12th
Showing 1-24 of 59 results


