29 results
Statistics center interactive whiteboards
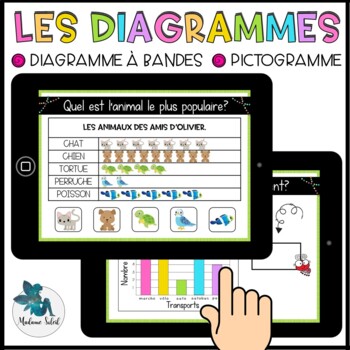
Les diagrammes au 1er cycle Boom Cards French distance learning
French pictograph, french graph. Activité mathématique de statistique permettant de travailler le diagramme, les diagrammes, le pictogramme, les graphiques, l'histogramme ou le diagramme à bande pour des élèves de 1re année, 2e année et 3e année. Super en groupe, en atelier, dans les centres mathématiques, à distance et à la maison. French immersion.Viens l'essayer avant de l'acheter !C'est quoi?20 Cartes Boom dans lesquelles les élèves doivent :- Analyser les diagrammes.- Répondre à la question
Subjects:
Grades:
1st - 3rd
Also included in: Bundle 1re année mai mathématique BOOM CARDS French distance learning
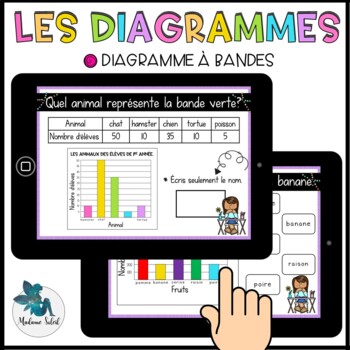
Les diagrammes à bandes en 2e année Boom Cards
French graph. Activité mathématique de statistique et d'enquête permettant de travailler le diagramme, l'histogramme ou le diagramme à bande pour des élèves de 2e année et 3e année. Super en atelier de math, dans les centres mathématiques, à distance et à la maison. Viens l'essayer avant de l'acheter !C'est quoi?20 Cartes Boom dans lesquelles les élèves doivent :- Analyser les diagrammes.- Répondre à la question.DescriptionC'est une activité auto-correctrice avec laquelle l'enfant reçoit une rét
Subjects:
Grades:
2nd - 3rd
Also included in: Bundle 2e année mars mathématique Boom Cards
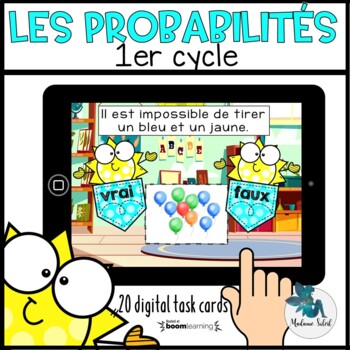
Les probabilités en 1re et 2e année Boom Cards French distance learning
French probability. Activité mathématique pour travailler les probabilités. Le vocabulaire mathématique suivant sera travaillé : possible, certain et impossible à travers des beignes, des ballons ou des dés.Super en grand groupe, en petit groupe, pour le tableau blanc, dans les centres mathématiques, en orthopédagogie, à distance et à la maison.Viens l'essayer avant de l'acheter !C'est quoi?20 Cartes Boom dans lesquelles les élèves doivent :- Déterminer si l'énoncé est vrai ou faux.- Appuyer sur
Subjects:
Grades:
1st - 2nd
Also included in: Bundle 1re année mars mathématique BOOM CARDS French distance learning
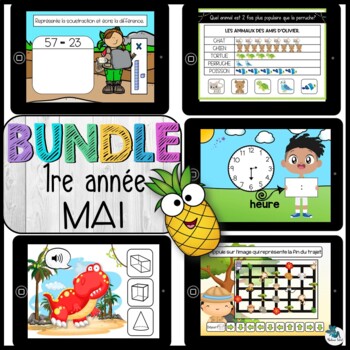
Bundle 1re année mai mathématique BOOM CARDS French distance learning
Bundle de Boom Cards 1re année mathématique de mai sur l'addition de nombres à 2 chiffres avec manipulation, la soustraction sans emprunt, les diagrammes, les pictogrammes, la statistique. lire l'heure, le temps, le trajet ou l'orientation spatiale, les solides, les faces planes et les face courbes, la géométrie pour les élèves de 1re année et de 2e année. Super en atelier, en centre mathématique, à distance ou à la maison. Un total de 100 cartes BoomVoici les 5 tableaux :- Addition et soustract
Subjects:
Grades:
1st - 2nd
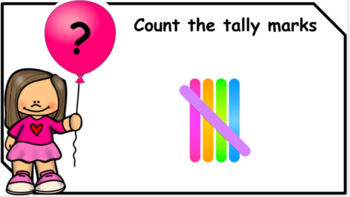
*No Prep* Counting Tally Marks *Google Slides/Distance Learning
This is designed for Google Slides *Widescreen 16:9.I want to help all those teachers struggling to find new ideas for their Google Slides. I will be adding more maths resources to my store.The student types the answer into the text box.There are 40 slides.Tally marks from 1-20 are used. There are 2 copies, a girl and boy option.
Subjects:
Grades:
K - 3rd
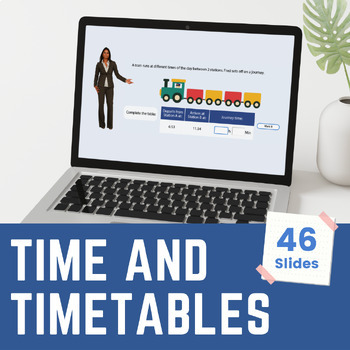
Sixth Grade Time and Timetables Digital Math Lesson and Activities
Sixth Grade Time and Timetables Digital Math Lesson and ActivitiesTeach your math class about tables and timetables with this amazing bundle of interactive self-marking activities.In this lesson, learners will be able to:look at different ways of writing time e.g. 12- and 24- hour clockexplore different units of timeextract information from a simple timetablecalculate time problem in context, including length of time of journeys.The lesson can be used as whole class teaching by teachers and at h
Subjects:
Grades:
5th - 6th
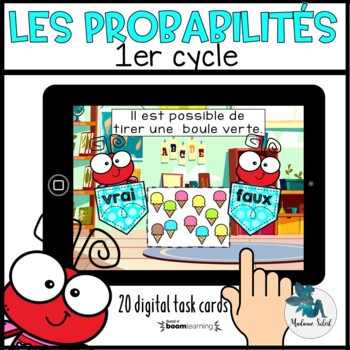
Les probabilités en 1re et 2e année Boom Cards French distance learning
French probability. Activité mathématique pour travailler les probabilités. Le vocabulaire mathématique suivant sera travaillé : possible, certain et impossible à travers des glaces, des crèmes glacées ou des dés.Super en atelier de math, pour le tableau blanc, dans les centres mathématiques, en orthopédagogie, à distance et à la maison.Viens l'essayer avant de l'acheter !C'est quoi?20 Cartes Boom dans lesquelles les élèves doivent :- Déterminer si l'énoncé est vrai ou faux.- Appuyer sur le bon
Subjects:
Grades:
1st - 2nd
Also included in: Bundle 2e année mai mathématique
Mean, Median, Mode, Range Smartboard Slides Lesson Measures of Central Tendency
You'll LOVE this great Data Measures-of-Central-Tendency: Mean, Median, Mode, & Range Smartboard-Slides-Lesson. Your students will LOVE this interactive smartboard lesson that teaches and practices Mean, Median, Mode, and Range, along with a Card Game for practice. YOU GET 28 slides total, a very comprehensive and complete lesson. You'll enjoy using this great smartboard lesson year after year. WARNING: You MUST have SMART Technologies SMART software, and a SMARTBOARD to teach from, to effec
Subjects:
Grades:
4th - 7th
Box and Whisker Plots Smartboard Slides Lesson Step by Step How to Constuct
Math Teachers ~ You'll LOVE this GREAT Smartboard-Slides-LESSON that teaches students step-by-step how to construct a Box-and-Whisker-Plot; Least/Greatest Value, Lower/Upper Quartile, Median, and how to Find the Interquartile and Range. 37 slides in all! Your students will LOVE this smartboard lesson. WARNING: You MUST have SMART Technologies SMART software, and a SMARTBOARD to teach from, to effectively download, open and use this Interactive Smartboard Lesson. Go to https://legacy.smarttech.co
Subjects:
Grades:
5th - 8th, Staff
Also included in: Box & Whisker Plots Smartboard Slides Notes Worksheet BUNDLE
Approximate Probability of a Chance Event - 7.SP.6
Great lesson for understanding difference between theoretical and experimental probability. Hands on projects reinforce earlier lessons, while introducing new concepts. Scaffolded lesson provides for classroom differentiation. Can be used as a lesson leader, guided practice, independent practice, for cooperative learning and math centers, or as an assessment. Use with smartboard, projector, computer, pad or as printable. Lesson is complete - NO PREP. Editable version included.
Objectives:
- Co
Subjects:
Grades:
6th - 8th
CCSS:
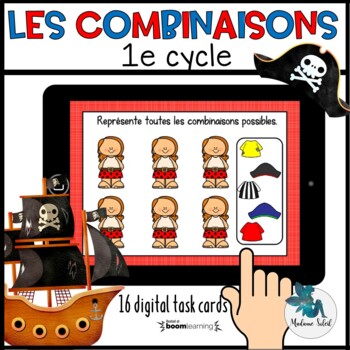
Les combinaisons chez les pirates Boom Cards French distance learning
Activité mathématique permettant de travailler sur le hasard (possibilités) et les combinaisons possibles sous le thème des pirates. Cette activité ne permet pas d'être autocorrigé. Une supervision adulte est nécessaire pour vérifier la compréhension de l'élève.Super en grand groupe, en petit groupe, pour le tableau blanc, dans les centres mathématiques, en orthopédagogie, à distance et à la maison.Viens l'essayer avant de l'acheter !C'est quoi?16 Cartes Boom dans lesquelles les élèves doivent
Subjects:
Grades:
1st - 3rd
Also included in: Bundle 1re année mars mathématique BOOM CARDS French distance learning
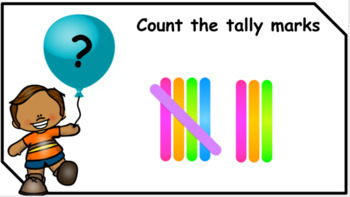
*FREE Sample* No Prep Tally Marks *Google Slides/Distance learning*
This is a free sample of my No Prep Digital Resource of Counting Tally Marks.This is designed for Google Slides *Widescreen 16:9.I want to help all those teachers struggling to find new ideas for their Google Slides. The student types the answer into the text box.I have the full version with 40 slides for sale in my store.
Subjects:
Grades:
K - 3rd
Dot Plots and Data Distribution Displays Smartboard Slides Lesson
Dot-Plots and Data-Distribution Smartboard-Slides-Lesson covers Data-Distribution and Creating Dot-Plots. Lots of practice problems provided. You'll love using this Smartboard Lesson to teach from year after year! WARNING: You MUST have SMART Technologies SMART software, and a SMARTBOARD to teach from, to effectively download, open and use this Interactive Smartboard Lesson. Go to https://legacy.smarttech.com/en/products/education-software/smart-learning-suite/download/trial to download a free t
Subjects:
Grades:
4th - 7th, Staff
Statistical Questions Activity Manual - 6.SP.1
Discover the difference between "statistical" questions and other questions. Scaffolded lesson provides for classroom differentiation. Can be used as a lesson leader, guided practice, independent practice, for cooperative learning and math centers, or as an assessment. Use with smartboard, projector, computer, pad or as printable. Lesson is complete - NO PREP.
Objectives:
- Identify statistical questions
- Write statistical questions
- Answer statistical questions
Includes 6 problem pages and an
Subjects:
Grades:
5th - 8th
CCSS:
Histograms Smartboard Lesson Data Displays Graphs Graphing
TERRIFIC Histograms-Smartboard-Slides-Lesson covers what a Histogram is, what they look like, features specific to Histograms, and lots of interactive practice for students to create Histograms and be able to read Histograms and find answers. This smartboard lesson also combines activities to practice Histograms. Your students will LOVE learning about Histograms with this Smartboard Lesson. You'll use this year after year to teach Histograms. Created by Tricks and Treats for Teaching. WARNING: Y
Subjects:
Grades:
4th - 6th
Categorical Data Smartboard Slides Lesson Displaying Analyzing Organizing
Categorical-Data Math Smartboard-Slides-Lesson covers the TEKS for 6th grade Math specific to this skill. Lots of great examples and teaching, along with interactive practice for your students. You'll LOVE this resource and use it year after year! WARNING: You MUST have SMART Technologies SMART software, and a SMARTBOARD to teach from, to effectively download, open and use this Interactive Smartboard Lesson. Go to https://legacy.smarttech.com/en/products/education-software/smart-learning-suite/
Subjects:
Grades:
5th - 8th
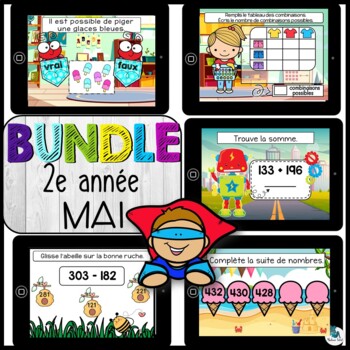
Bundle 2e année mai mathématique
Bundle ou ensemble d’activité mathématique de Boom Cards permettant de travailler les notions suivantes : la soustraction de nombre à 3 chiffres avec emprunt ou avec échange, l’addition de nombre à 3 chiffres avec retenue ou avec échange, les suites de nombres, les règles de régularité, la régularité, les combinaisons, les possibles, les possibilités et les probabilités en 2e année ou au 1er cycle.Parfait pour la 2e année en atelier de math ou en centre mathématique.Voici les 5 tableaux-Les prob
Subjects:
Grades:
2nd
Probability - 7.SP.5
Also included in the 7.SP.5 Probability Full Lesson Bundle. Understand probability of a chance event can be measured with a number between 0 and 1. Scaffolded lesson provides for classroom differentiation. Can be used as a lesson leader, guided practice, independent practice, for cooperative learning and math centers, or as an assessment. Use with smartboard, projector, computer, pad or as printable. Lesson is complete - NO PREP. Editable version included.
Objectives:
- Know probability is a n
Subjects:
Grades:
6th - 8th
CCSS:
Median Mode Range Smartboard Slides Lesson Measures of Central Tendency
Incredible ~ 31 slides ~ Smartboard-Slides-Math-Lesson over Median, Mode, and Range (Measures of Central Tendency). This is EVERYTHING you need to teach these three measure-of-central-tendencies. Students will enjoy the interactive slides where they work problems at the Smartboard. Please be sure to see my other smartboard lesson on Finding the Mean, Average. You'll enjoy using this resource year after year. WARNING: You MUST have SMART Technologies SMART software, and a SMARTBOARD to teach from
Subjects:
Grades:
4th - 7th, Staff
Histograms and Box and Whisker Plots - 6.SP.4
Recognize, analyze and create histograms and box and whisker plots. Scaffolded lesson provides for classroom differentiation. Can be used as a lesson leader, guided practice, independent practice, for cooperative learning and math centers, or as an assessment. Use with smartboard, projector, computer, pad or as printable. Lesson is complete - NO PREP.
Objectives:
- Identify histograms and box and whisker plots
- Analyze data using histograms and box and whisker plots
- Understand when data shoul
Subjects:
Grades:
5th - 8th
CCSS:
Represent and Interpret Data Using Line Plots - 4.MD.4
Read and draw line plots, and use the data to answer basic questions. Scaffolded lesson provides for classroom differentiation. Can be used as a lesson leader, guided practice, independent practice, for cooperative learning and math centers, or as an assessment. Use with smartboard, projector, computer, pad or as printable. Lesson is complete - NO PREP.
Objectives:
- Interpret line plots
- Given data sets create line plots
- Answer questions using data in line plots
Includes 6 practice pages and
Subjects:
Grades:
3rd - 6th
CCSS:
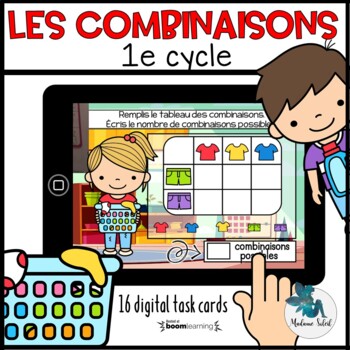
Les combinaisons possibles Boom Cards
Activité mathématique de Boom Cards permettant de travailler le hasard, les possibilités et les combinaisons possibles sous le thème des vêtements. Super en atelier de math, pour le tableau blanc, dans les centres mathématiques, en orthopédagogie, à distance et à la maison.Viens l'essayer avant de l'acheter !C'est quoi?16 Cartes Boom dans lesquelles les élèves doivent :- Déplacer les vêtements sur le tableau.- Respecter les combinaisons possibles.DescriptionC'est une activité auto-correctrice av
Subjects:
Grades:
1st - 2nd
Also included in: Bundle 2e année mai mathématique
100 Chart With Animated Nurmbers
Entertain and motivate your students to learn to count to 100 with this Promethean Flipchart.
Subjects:
Grades:
K - 2nd
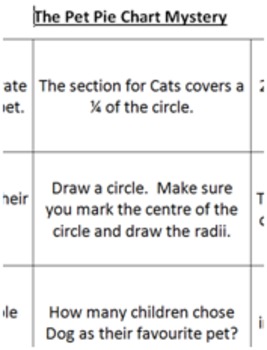
The Pet Pie Chart Mystery
Mysteries let pupils discover how to solve a problem. The child can start at any point. All clues are right, but not all need to be used to solve the puzzle
Content : Pie Chart; Draw Circle; Measure Angles; Draw a table; simple fractions; Angles; Problem Solving
Subjects:
Grades:
5th - 8th
Showing 1-24 of 29 results


