52 results
Statistics centers for Easel
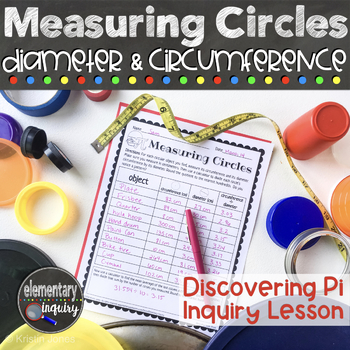
Measuring Circle Circumference & Diameter to Discover Pi - Pi Day Inquiry Lesson
Have fun finding Pi by measuring the circumference and diameter of circles of all sizes! Students will calculate the ratio of the length of a circle’s diameter to its circumference. They’ll discover that the circumference is always a little more than three times as long as the diameter. This full lesson plan and teacher script will help you lead an inquiry based investigation and class discussion. It’s perfect for an introduction to these geometry concepts, or for a fun Pi Day activity.A full, f
Subjects:
Grades:
5th - 7th
Types:
CCSS:
Also included in: Pi Day Activities - Measuring Circles Diameter, Circumference, and Area
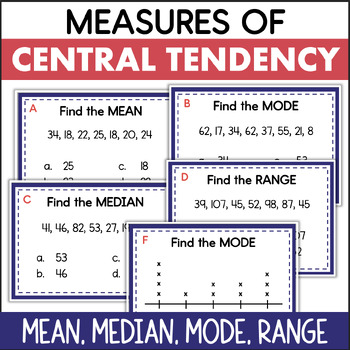
Mean Median Mode Range Measures of Central Tendency Data Task Cards
These data task cards are a great way for students to practice analyzing data to find the mean, median, mode, and range!There are several types of questions, all addressing measures of central tendency. Some require students to interpret a data set of whole numbers. Others involve data presented in a line plot. The last type of question requires the student to choose the correct method for finding the mean, median, mode, or range.This math resource includes:16 task cardsrecording sheetanswer key
Subjects:
Grades:
5th - 7th
Types:
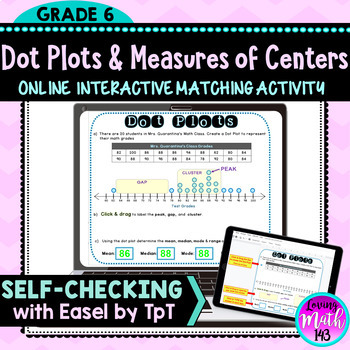
Dot Plots and Measures of Center Digital Activity for Distance Learning
Dot Plots & Measures of Center Interactive Activity for Distance LearningStudents will create a Dot Plot / Line Plot for a data set with 20 values. Students will identify the cluster, peak, and gap located on the Dot Plot. Students will also find the mean, median, mode, and range for the data set. it is a perfect resource for distance learning and students using Google Classroom™. This activity is interactive. Students will click and drag to move the dots to create the dot plot. In addition
Subjects:
Grades:
6th
Types:
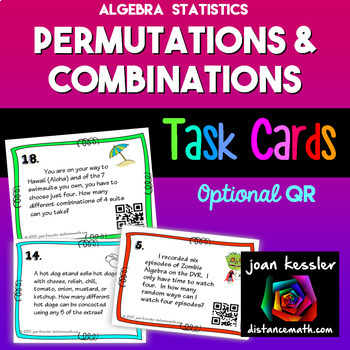
Permutations and Combinations Task Cards plus QR
This set of Combinations, Permutations, and Counting Task Cards with applications will really have your students thinking.This activity reinforces the concepts of permutations, combinations, and counting principles. The concepts are not separated on the cards, nor coded, so students must first decide what type of question it is before solving. The cards can also be used for a sorting activity. The difficulty levels are mixed on the cards. Included: Two sets of 24 cards, one with QR codes and
Subjects:
Grades:
7th - 10th
Types:
CCSS:
Also included in: Algebra 1 Activity Bundle
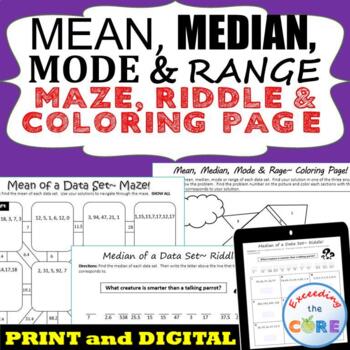
MEAN, MEDIAN, MODE, & RANGE Mazes, Riddles & Coloring Page | Print and Digital
Have your students apply their understanding of finding the MEAN, MEDIAN, MODE, & RANGE of data sets with these fun activities including a maze, riddle and coloring activity. What is Included:1. Finding the Mean MAZEThis is a self-checking worksheet that allows students to strengthen their understanding of finding the mean of positive whole numbers. Students use their answers to navigate through the puzzle.2. Finding the Median RIDDLEStudents find the median of positive whole numbers and use
Subjects:
Grades:
5th - 7th
Types:
Also included in: 6th Grade Math Assessments, Notes, Task Cards, Worksheets BUNDLE
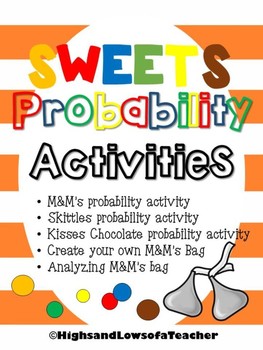
Sweets Probability Activities (chocolate, candy, M&Ms, Skittles, Kisses)
Uses chocolates or candy (M&Ms, Skittles, Kisses) to practice probability!
What's included-
*Colored candy probability activity: have students randomly pick colored candy and tally what's picked to experiment probability
*Colored candy probability activity reflection page- have students reflect on the experiment and explain their thinking
*M&M's probability activity: have students figure out how many M&M's are in a bag and what color of each by using probability
*M&M's probabil
Subjects:
Grades:
2nd - 8th
Types:
Also included in: Probability Activity BUNDLE
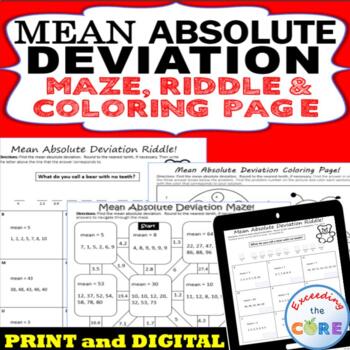
MEAN ABSOLUTE DEVIATION Mazes, Riddles & Coloring Page | Print and Digital
Have your students apply their understanding MEAN ABSOLUTE DEVIATION with these fun activities including a maze, riddle and coloring activity.What's Included:1. Mean Absolute Deviation MAZEThis is a self-checking worksheet that allows students to strengthen their understanding of finding the mean absolute deviation. Students use their answers to navigate through the puzzle.2. Mean Absolute Deviation RIDDLEStudents find the mean absolute deviation of various data sets. Students use their answer
Subjects:
Grades:
5th - 7th
Types:
Also included in: 6th Grade Math Assessments, Notes, Task Cards, Worksheets BUNDLE
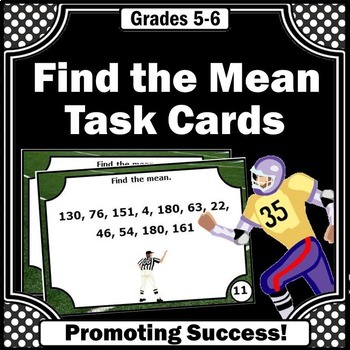
Probability and Statistics Activities Find the Mean Average of Data Task Cards
You will download 30 math task cards for your 5th and 6th grade students to practice and review finding the mean task. They work well with your measures of central tendency unit. A mean in math is the average of a data set, found by adding all numbers together and then dividing the sum of the numbers by the number of numbers.For your convenience, you will download both TPT digital EASEL and printable PDF resource formats. ☛ Please click on the PREVIEW above.You may use the printable task cards i
Subjects:
Grades:
5th - 6th
Types:
CCSS:
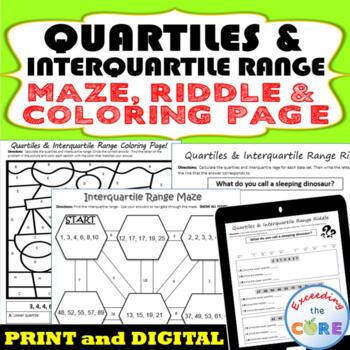
QUARTILES & INTERQUARTILE RANGE Maze, Riddle, Coloring Page | PRINT & DIGITAL
Have your students practice finding the QUARTILES, MEDIAN AND INTERQUARTILE RANGE of a data set with these fun activities including a maze, riddle, and coloring activity. What's Included:1. Quartiles and Interquartile Range COLORING ACTIVITY Students are prompted to find the first quartile, median, third quartile, and interquartile range (IQR) . Students use their solutions to color the picture. 2. Interquartile Range MAZEThis is a self-checking worksheet that allows students to strengthen thei
Subjects:
Grades:
6th - 8th
Types:
Also included in: 7th GRADE MATH Assessments, Warm-Ups, Task Cards, Worksheets BUNDLE
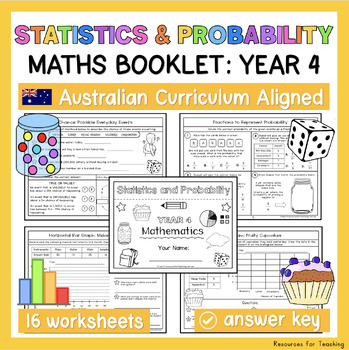
YEAR 4 Statistics and Probability Worksheets and Booklet - Australian Curriculum
This printable booklet includes 16 engaging worksheets to support Year 4 students learning about Statistics and Probability in the Mathematics syllabus. Plenty of outcomes are covered within this resource to save you time prepping activities for your students! The main topics covered within this resource and strand of learning include: chance and data representation & interpretation✩ ALL Year 4 Australian Curriculum Maths Outcomes are linked to this 'Statistics and Probability' booklet.✩ Inc
Subjects:
Grades:
4th
Types:
Also included in: YEAR 4 Maths Booklet Bundle - Australian Curriculum Outcomes
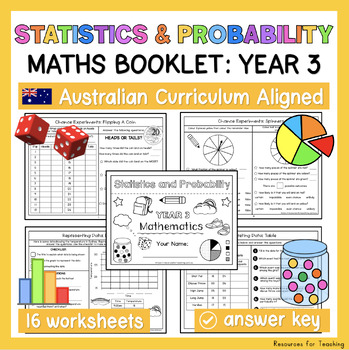
YEAR 3 Statistics and Probability Worksheets and Booklet - Australian Curriculum
This printable booklet includes 16 engaging worksheets to support Year 3 students learning about Statistics and Probability in the Mathematics syllabus. Plenty of outcomes are covered within this resource to save you time prepping activities for your students! The main topics covered within this resource and strand of learning include: chance and data representation & interpretation✩ ALL Year 3 Australian Curriculum Maths Outcomes are linked to this 'Statistics and Probability' booklet.✩ Inc
Subjects:
Grades:
3rd
Types:
Also included in: YEAR 3 Maths Booklet Bundle - Australian Curriculum Outcomes
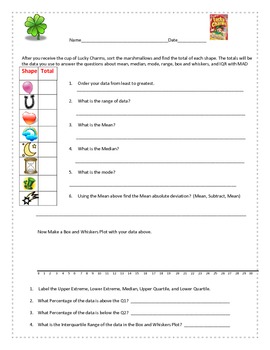
Lucky Charms -Statistics, Mean, Median, Mode, Box and Whiskers Plot
Lucky Charms -Statistics, Mean, Median, Mode, Box and Whiskers Plot.
This is a fun activity to do with your kids to review statistics. The students will enjoy sorting the marshmallows and counting the data to be used for statistics. The first part is individual data but the second part is combining the class data. Make sure your data range will fit on the box plot.
Subjects:
Grades:
4th - 8th
Types:
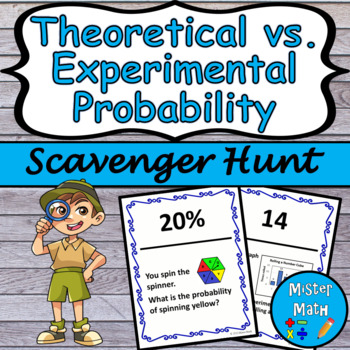
Theoretical vs. Experimental Probability Scavenger Hunt
Looking for a way to get your students out of their seats and engaged in the content? This scavenger hunt is just what you've been looking for to help students strengthen their skills with theoretical and experimental probability! Perfect for extra practice or a review before an assessment! The questions included are meant to be posted around the room. Students will then start at a question, working either independently, with a partner, or with a group. Once the question has been answered, stude
Subjects:
Grades:
6th - 9th
Types:
Also included in: Probability MEGA BUNDLE
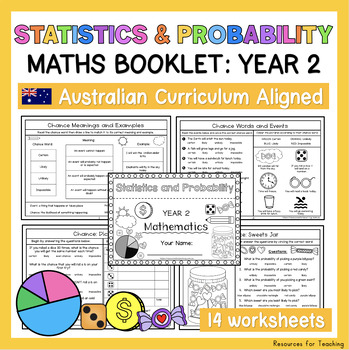
YEAR 2 Statistics and Probability Worksheets and Booklet - Australian Curriculum
This printable booklet includes 14 engaging worksheets to support Year 2 students learning about Statistics and Probability in the Mathematics syllabus. Plenty of outcomes are covered within this resource to save you time prepping activities for your students! The topics covered within this resource and strand of learning include chance and data representation & interpretation.✩ ALL Year 2 Australian Curriculum Maths Outcomes are linked to this 'Statistics and Probability' booklet.The follow
Subjects:
Grades:
2nd
Types:
Also included in: YEAR 2 Maths Booklet Bundle - Australian Curriculum Outcomes
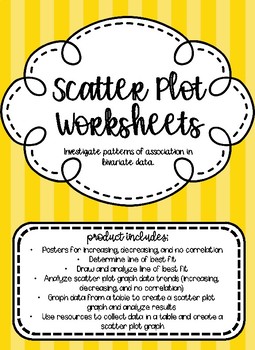
Scatter Plot Graph Worksheets
A collection of worksheets to use when teaching how to investigate patterns of association in bivariate data. Product includes 3 posters for students to reference how to determine if data is increasing, decreasing, or has no correlation. Types of worksheets include:
-Determine line of best fit
-Draw and analyze line of best fit
-Analyze scatter plot graph data trends (increasing, decreasing, and no correlation)
-Graph data from a table to create a scatter plot graph and analyze results
-Use reso
Subjects:
Grades:
1st - 12th
Types:
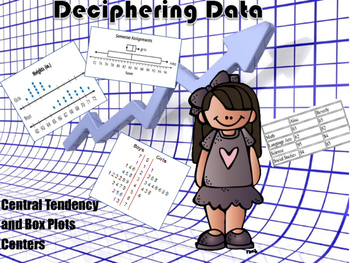
Central Tendency & Box Plots Centers with Mean Absolute Deviation
This is a collection of centers that I created for review. There are five central tendency centers, five box plots centers, and five mean absolute deviation centers. Each card has several questions that require calculations and analyzing information. I printed them out on card stock paper and made cards out of them with the answers on the back of each card. This is a great way to review these concepts.
Subjects:
Grades:
4th - 8th
Types:
CCSS:
Percent Bar Graphs TEKS 6.12D
This product includes:•Notes•2 Guided practice problems•1 Independent practice problem•25 Task cards – digital format•Quick check – 5 questionsAll problems are in test-prep format.The task cards are designed to be used digitally. They may be posted to your class website - Save PAPER! ....or you may print them and hang them around the room.
Subjects:
Grades:
6th - 8th
Types:
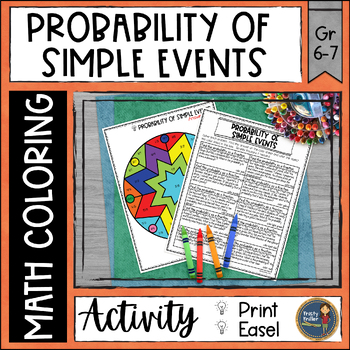
Probability of Simple Events Math Color by Number
This fun math coloring page is all about finding the probability of simple events! Students can work on finding the probabilities of the events and use the code to color in the picture. Math color sheets are perfect for keeping early finishers engaged, as well as for review and homework.What's Included:✓ 1 sheet of problems (10 probability of simple events problems)✓ 1 color page✓ answer keyThis resource is great for:✧ Math Centers, Math Stations✧ At Home Learning, Homework✧ Skill Practice or Re
Subjects:
Grades:
6th - 7th
CCSS:
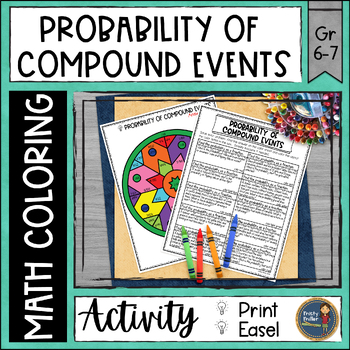
Probability of Compound Events Math Color by Number
This fun math coloring page is all about finding the probability of compound events! Students can work on finding the probabilities of the events and use the code to color in the picture. Math color sheets are perfect for keeping early finishers engaged, as well as for review and homework.What's Included:✓ 1 sheet of problems (10 probability of compound events problems)✓ 1 color page✓ answer keyThis resource is great for:✧ Math Centers, Math Stations✧ At Home Learning, Homework✧ Skill Practice o
Subjects:
Grades:
6th - 7th
CCSS:
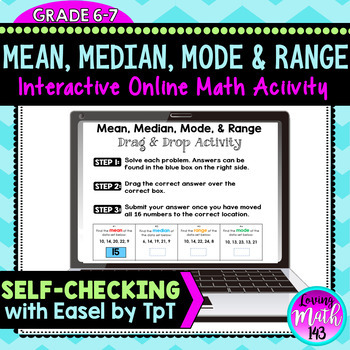
Mean, Median, Mode, Range Digital Math Activity (Self-Checking on Easel)
Middle school math students can practice statistics and the measures of center using this interactive activity for Google Drive. Students will use find the mean, median, mode, range and outlier for 12 problems. Students will click and drag using this interactive activity. It is a perfect resource for distant learning and students using Google Classroom™. You can share this activity with your students through Google Classroom™ or Google Drive™, which they can type directly onto, and then share
Subjects:
Grades:
6th - 7th
Types:
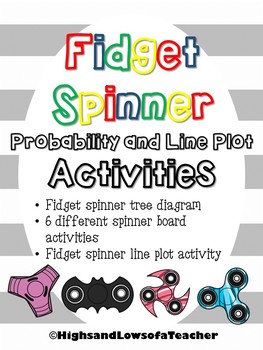
Fidget Spinner Math (line plot, probability, tree diagram)
Use these fidget spinner math activities to engage students in their learning!
What's included-
*Fidget spinner probability tree diagram
*6 different spinner boards activity--kids can spin their fidget spinner to figure out probability
*fidget spinner line plot activity
Great for end of the year activity!
Please leave me a feedback to let me know what you think! Thank you!!
Check out my other probability activity worksheets and my probability bundle to save money!
Coin, Dice, Colored Tiles P
Subjects:
Grades:
3rd - 8th
Types:
Also included in: Probability Activity BUNDLE
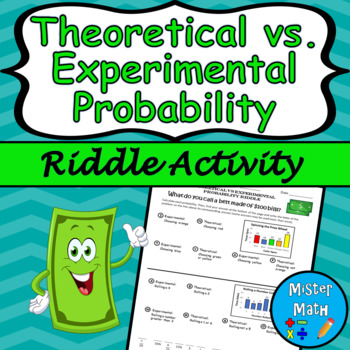
Theoretical vs. Experimental Probability Riddle Activity
Looking for a fun way for students to practice theoretical and experimental probability? This riddle activity is an engaging way for students to strengthen their skills in calculating probability while having fun! Guaranteed they will get a kick out of the terrible punchline at the end! This riddle activity contains 12 questions where students will be asked to find the theoretical and experimental probability of various events by analyzing data in bar graphs. An answer key is included.☆ Perfect
Subjects:
Grades:
6th - 9th
Types:
Also included in: Probability MEGA BUNDLE
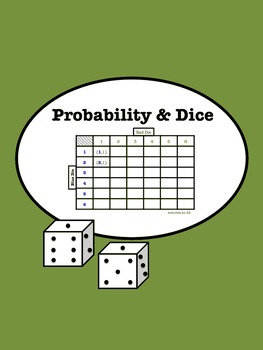
Probability and Dice (Distance Learning)
Kids are less familiar with board games these days. As a result, they need extra practice solving dice problems when learning about probability. They simply are not as familiar with dice (number cubes) as they once might have been.This activity consists of two worksheets (A and B).- The first worksheet includes a chart for students to complete representing the thirty-six outcomes that are possible when rolling a pair of dice. Fifteen probability questions then require students to examine the
Subjects:
Grades:
6th - 10th
Types:
6th Grade Math- Common Core Standard Vocabulary Exit Tickets & Answer Key
6th grade CCSS Math Vocabulary Exit TicketsPerfect for checking how your students are doing in two quick questions. These exit tickets can be printed, or students can complete them using the Easel.Formatted to fit with the Common Core Standards, each ticket contains two different vocabulary words aligned with Common Core Standards.Also included is a master list of all vocabulary words used on the exit tickets, great to use for your classroom word wall!This set includes exit tickets for vocabular
Showing 1-24 of 52 results


