126 results
Statistics projects for Google Apps
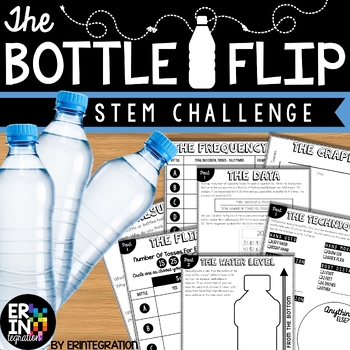
Water Bottle Flip STEM Challenge + STEM Activity
The ORIGINAL water bottle flip STEM activity and lab! Water bottle flip at school? Absolutely! Students will love this on-trend STEM challenge inspired by the popular YouTube water bottle flipping challenge where students toss a water bottle and attempt to land it straight up. Practice scientific method with some probability, fractions and data collection in the mix while having fun!This self-paced, low-prep, project based learning water bottle flip STEM challenge is print-and-go. Each activit
Subjects:
Grades:
3rd - 6th
Types:
CCSS:
NGSS:
K-2-ETS1-2
, K-2-ETS1-3
, MS-ETS1-2
, K-2-ETS1-1
, 3-5-ETS1-3
...
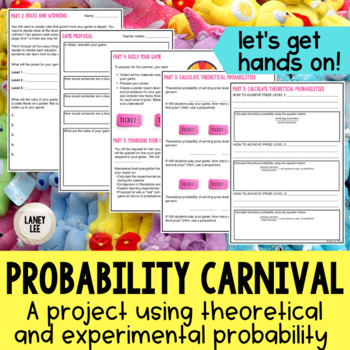
Probability Carnival Game Project - PDF & Digital
Looking for a fun, hands on way to bring probability to life? Are you ready to move past the "sit and get" style of whole group instruction? If you answered yes to either of those questions, then this resource is for you!Keep your students engaged and accountable with the interactive, versatile Probability Carnival! The steps of this project are designed to be rigorous and require students to predict, reflect, connect, and think critically about the situations being investigated.Using this proje
Subjects:
Grades:
6th - 8th
Types:
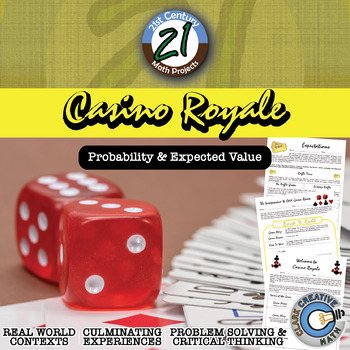
Casino Royale -- Expected Value & Probability Game - 21st Century Math Project
Your students might be begging for for a day for them to play games. Let it be on your terms in this 21st Century Math Project! This Expected Value and Probability Project focuses on one of the more emphasized aspects of the Common Core Standards. Students will be asked to design their own games with defined expected value and host it in a Game Day event! The student that collects the most "Swagg Cash" will forever (or at least for 36 hours) be known as the Master of Swagg. ***THIS PRODUCT HAS B
Subjects:
Grades:
6th - 12th
Types:
CCSS:
Also included in: Probability & Expected Value Unit Bundle - Distance Learning Compatible
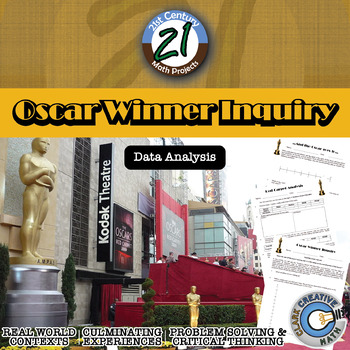
Oscar Winner -- Data Analysis & Statistics Inquiry - 21st Century Math Project
Utilize the last twenty years of Oscar winners as a data set to guide your students through creating box and whisker plots, histograms, and exploring mean, median, and mode -- in one 21st Century Math Project!Does the age of the award winning star in a film relate to the overall gross of the movie? Student will explore this inquiry question and use the data to support their conclusion.In this 8 page document you will be given a mapping to the Content Standards, an outline for how to implement t
Subjects:
Grades:
6th - 12th
Types:
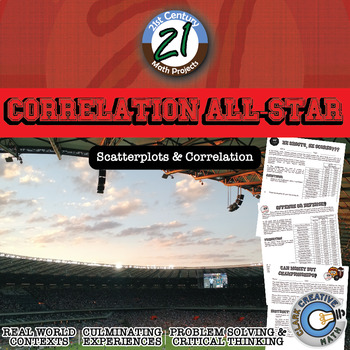
Correlation All-Star -- Sports Data Analysis - 21st Century Math Project
Bring an authentic sports-based math project to your Algebra, Algebra 2 or PreCalculus classroom with Lines of Best Fit and Correlations! All in this 21st Century Math Project! Using data from the MLB, NBA, NFL and NHL students investigate correlations to some of sports most common questions like: "Do more shots result in more goals?" "Do hitters or pitchers have more impact on a team's wins?""What NFL stat is most strongly correlated with wins?" and the grand-daddy..."Can money buy championship
Subjects:
Grades:
7th - 12th
Types:
CCSS:
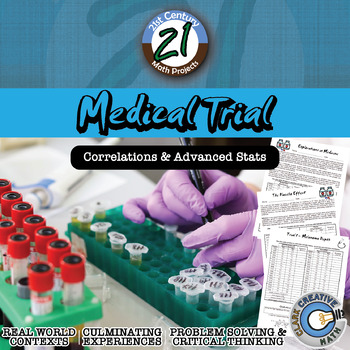
Medical Trial -- Statistics & T-Test - 21st Century Math Project
Bring your students into the world of double blind medical studies. Every day, doctors and hospitals rely on scientific studies and research to make healthcare decisions for patients. Are some medicines more effective than others? Do certain types of patients benefit more from certain types of treatments? Due to the security of medical records, studies are somewhat limited in their scope and are generally carried out at universities and research hospitals. At these facilities ground breaking wo
Subjects:
Grades:
8th - 12th
Types:
CCSS:
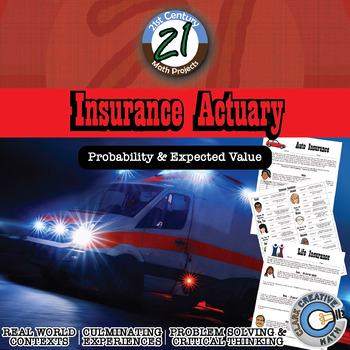
Insurance Actuary -- Expected Value - 21st Century Math Project
Insurance actuaries work hard to analyze risk and make premium recommendations for customers. There is a careful balance between finding an appropriate value based on the risk and creating profit for the insurance company. In this 21st Century Math Project, students where different hats as an actuary to understand insurance!This product includes 4 prep assignments that challenge students in expected value and insurance to build their skills and their thinking for the final project.In this 28 pag
Subjects:
Grades:
8th - 12th
Types:
CCSS:
Also included in: Probability & Expected Value Unit Bundle - Distance Learning Compatible
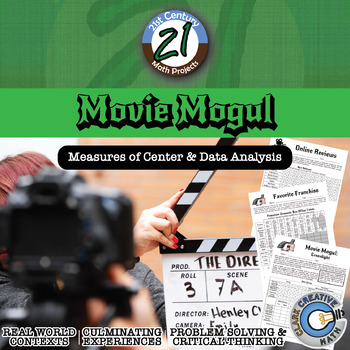
Movie Mogul - Mean, Median & Variation - Project - Distance Learning Compatible
Nowadays online reviews have a huge impact on business. Customer ratings help people decide what to buy and what products to avoid. Movies and entertainment are moving toward the world of intense data analysis of audience views to make business decisions. Companies like Amazon and Netflix have poured resources into developing original content. Let your students sit in the driver's seat! -- and practice Mean, Median and Variation in this 21st Century Math Project!In this 22 page document you will
Subjects:
Grades:
6th - 12th
Types:
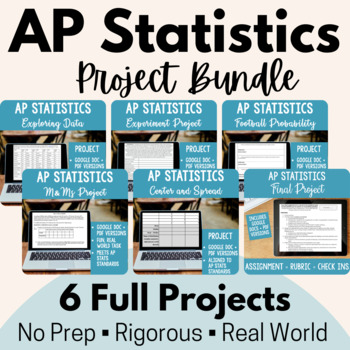
AP Statistics Project Bundle! 6 Projects + digital versions
Looking for some engaging, real-world projects to liven up your AP Statistics course? Need new materials that are ready for remote/ online learning? Want to make sure your AP Statistics course properly prepares student for the AP exam? Look no further - this bundle is for you! In this bundle, you will find four of my popular AP Statistics projects -- all updated to include EDITABLE google docs to assign to students as well as PDFs for printing, if you prefer. All projects also include a complete
Subjects:
Grades:
10th - 12th
Types:
The Survey Says -- Quantitative Questionnaire - 21st Century Math Project
With an influx of data and statistics standards into different levels of the Common Core, a greater emphasis is placed on students understanding data and administering questionnaires (now in the new Algebra 2). This 21st Century Math Project intends to help provide an outline and structure to a project that often has a great deal of freedom with it... perhaps too much freedom.In this project, students will understand different quantitative research question types, critique poorly asked questions
Subjects:
Grades:
7th - 12th
Types:
CCSS:
Data and Statistics Survey Project for Middle School | Low Prep | End of Year
Are you looking for a low prep project where students can be independent as you end the school year or finish your data and statistics unit? This editable project has students choose a real world question to investigate and analyze their finding. Sparked by their curiosity, students will survey a sample of the population and gather data. They will analyze the data and calculate statistics including mean, median, mode, range, IQR, and MAD. They will create a visual display to showcase their findi
Subjects:
Grades:
6th - 7th
Types:
Mean, Median, Mode, and Range Cereal Box Project | Editable - Distance Learning
This project is a great way to teach and/or review mean, median, mode, range, and statistical questions. This slideshow is editable and comes with a work page and rubric for students to complete their project. Each slide presents in sequence for easy review.Students will come up with a statistical question and collect data by surveying the class. They will use their data to fill out a frequency table, line plot, then find the mean, median, mode, and range of their data. Then, they will creat
Subjects:
Grades:
5th - 7th
Types:
Gridiron Glory -- "Big Game" Data & Paper Football - 21st Century Math Project
I have heard that Americans like Football. I have also heard about an important game that happens in February. I have heard that it's a day that nachos dread. In this 21st Century Math Project, students will complete a variety Football-based assignments related to the Statistics strands of the Common Core. The project caps off with a Paper Football tournament that asks students to use expected value to guide their decisions!This product includes 3 prep assignments that reaches a variety of learn
Subjects:
Grades:
6th - 12th
Types:
CCSS:
Also included in: Probability & Expected Value Unit Bundle - Distance Learning Compatible
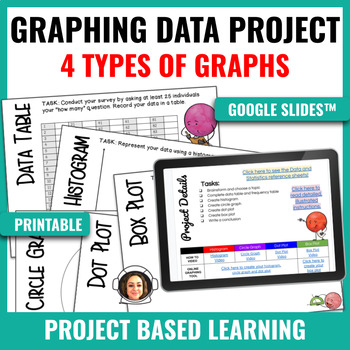
Graphing Data PBL - Histogram, Circle, Dot Plot, Box Plot
About this resource:This project takes students through the process of writing and conducting an original survey, then creating multiple representations of their data. Students will practice creating a histogram, circle graph, dot plot and box plot. Students will access "how to videos" as well as "online digital tools" that enable them to create the four graphs digitally. In the Google Slides™ version, support links are available for vocabulary references and data and statistics anchor charts. S
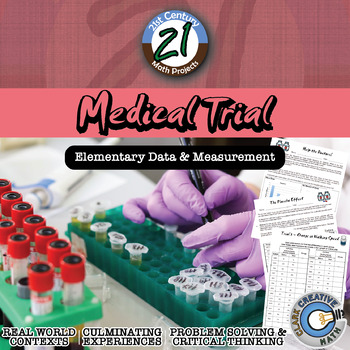
Medical Trial -- Elementary Data Edition - Medical - 21st Century Math Project
Bring your students into the world of double blind medical studies. Every day, doctors and hospitals rely on scientific studies and research to make healthcare decisions for patients. Are some medicines more effective than others? Do certain types of patients benefit more from certain types of treatments? Due to the security of medical records, studies are somewhat limited in their scope and are generally carried out at universities and research hospitals. At these facilities ground breaking wo
Subjects:
Grades:
3rd - 5th
Types:
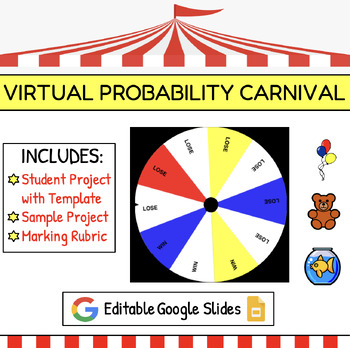
Virtual Probability Carnival | Math Project for End of Year | Google Slides
In this digital project students learn about what it means for a game to be fair as they design and play fair and unfair probability carnival games. This project is open-ended and can be easily differentiated to meet the needs of all learners and it is an engaging way to learn math during the end of year. The entire project is done using Google slides and Google forms, making it perfect for distance learning or the socially-distant classroom. This resource includes: Detailed teacher instructions
Subjects:
Grades:
4th - 9th
Types:
U.S. President -- Data Analysis & Statistics Inquiry - 21st Century Math Project
Engage students in data analysis through use of Presidential data in this 21st Century Math Project. Students will create box and whisker, stem and leaf, histograms and scatterplot through their investigations. In the end, students will take on the inquiry question: "Do US Presidents with the most children live longer after they have been inaugurated?" ***THIS PRODUCT HAS BEEN UPDATED WITH A GOOGLE SLIDES INTERACTIVE VERSION INCLUDED. REDOWNLOAD IF YOU HAVE IT ALREADY***-- In "He Entered a Youn
Subjects:
Grades:
6th - 12th
Types:
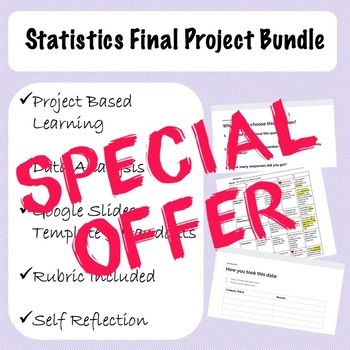
Statistics Final Project Bundle
This is the complete Statistics Final Project that I have used with my students for two years now. It includes a beginning Survey Worksheet, where students create a question and survey one another for data. Then, it also includes a self reflective rubric and a Google Slides presentation template. This project overall is a major hit, and students feel a great sense of accomplishment, especially when framing it as a long term, multi-step process.
Subjects:
Grades:
5th - 12th, Higher Education
Types:
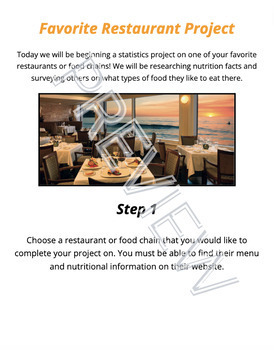
Scatter Plot and Bivariate Data Research Project
Students will begin a statistics project on one of their favorite restaurants or food chains! They will be researching nutrition facts and surveying others on what types of food they like to eat there. Through this data collection they will work on their skills of creating scatter plot graphs, creating relative frequency tables, and analyzing this data. This can be used either by paper or digitally. I used it the last two years during distance learning. Rubric included.
Subjects:
Grades:
7th - 12th
Types:
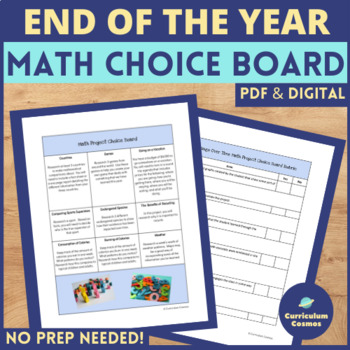
End of the Year Activities Math Graphing Project Choice Board
Looking for a fun way to review graphing and other Math concepts at the end of the year? The End of the Year Activities Math Project Choice Board consists of 9 different open-ended activities that help to give students voice and choice in their learning while investigating different math concepts. This board is designed with the middle school student in mind, each activity can be used in a home, hybrid, or school setting, and it comes in both a PDF and editable digital format.What's Included?Te
Subjects:
Grades:
6th - 7th
Types:
Also included in: End of the Year Activities Project Choice Board Bundle
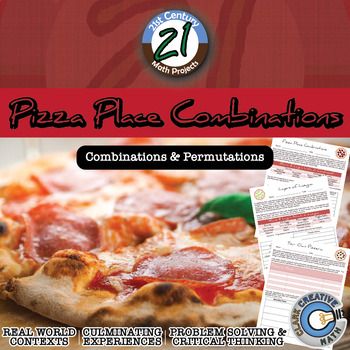
Pizza Place Combinations -- Combinations and Permutations - Math Projects
Pizza! Pizza! Mario & Luigi’s Pizzeria wants to make sure everyone knows that they are the best of the best. At their pizzeria, they allow customers to choose any number of toppings from their list to create pizzas and lasagnas. Join in on the fun with this 21st Century Math Project!In this 9 page PDF, you will be given a mapping to the Content Standards, an outline for how to implement the project, 3 different assignments for students to use, and an answer key. ***THIS PRODUCT HAS BEEN UPDA
Subjects:
Grades:
5th - 9th
Types:
CCSS:
Also included in: Probability & Expected Value Unit Bundle - Distance Learning Compatible
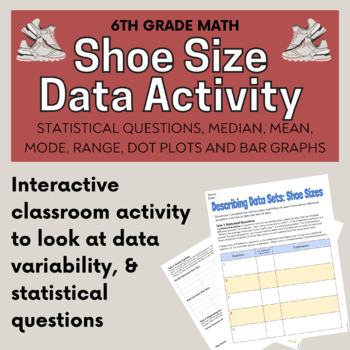
Collecting, Analyzing, and Graphing Data Shoe Size Activity - Printable Resource
Collecting, Analyzing, and Graphing Data Shoe Size Activity is a fun way to for students to learn about statistical questions, gather data from their classmates, organize data, determine the mean, median, mode and range of a data set, create dot plots, and create bar graphs. This product is 100% editable to best meet the needs of your students! This printable activity starts off with teaching students what statistical questions are. Students are then asked to create their own questions and deter
Subjects:
Grades:
6th - 8th
Types:

Normal Distribution in a real life context: Lake Tekapo Fish Mongers
Are you having trouble explaining what Normal distribution is and how it can be used in real life? Are your students craving a hands on activity that would make sense of this concept? Do you need an engaging project on statistics? Would you like an activity that already has enrichment, scaffolding and all of the material ready to go? If you answered yes to any or all of these questions, this project is tailor made for you!Your students will assume a role of a research team for a fishing company.
Subjects:
Grades:
10th - 12th, Higher Education
Types:
CCSS:
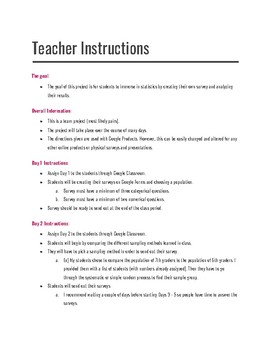
'Create Your Own Survey' Statistics Project!
Students will be engaged with statistics in this fun project!In pairs, students will create a survey to send out that will compare two populations. They will be responsible for creating samples of each population. They will then send out the survey and analyze the results. Students will use mean, median, range and interquartile range to describe their data. This is a great project for the end of the year.Access to the original Google Doc is available in the PDF.
Subjects:
Grades:
6th - 8th
Types:
Showing 1-24 of 126 results


