Statistics Digital Math Activity Bundle | Measures of Center | Google Slides
- Google Drive™ folder

What educators are saying
Products in this Bundle (4)
Bonus
Description
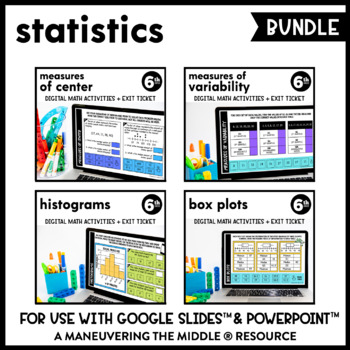
These supplemental digital math activities can be used to support data and statistics concepts. They are interactive (drag and match, using the typing tool, using the shape tool) and paperless through Google Slides™ and PowerPoint™.
Topics Included:
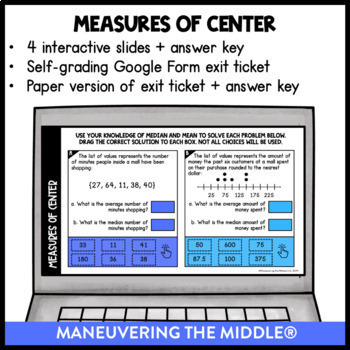
- Measures of Center (4 interactive slides + exit ticket)
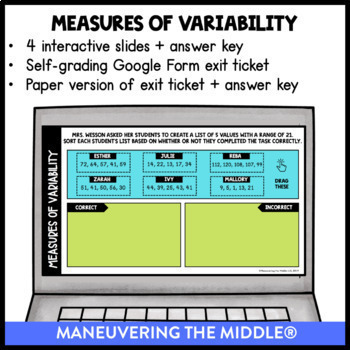
- Measures of Variability (4 interactive slides + exit ticket)
- Histograms (4 interactive slides + exit ticket)
- Box Plots (4 interactive slides + exit ticket)
What is included?
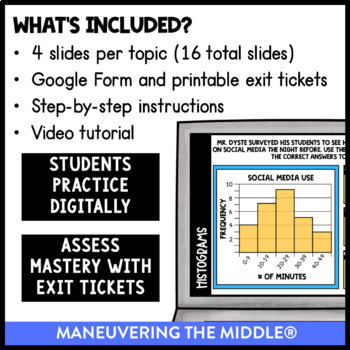
1. Paperless Math Activities: Engage students with these DIGITAL and PAPERLESS math activities that support data and statistics concepts. There are 16 total slides to practice describing data using measures of center and variability, and analyzing histograms and box plots. Students will enjoy dragging and matching, as well as using the typing and shape tool. You will love that you don’t have to make a visit to the copy room.
2. Exit Tickets (DIGITAL and PRINTABLE): Though we have included an answer key, it is easier to assess student mastery of the concepts through exit tickets. Each of the four topics has a 2-question exit ticket included both through Google Forms™ and a paper-based printable version available in the BONUS file download.
3. Video and Step-by-Step Instructions: A teacher guide with both video and step-by-step instructions have been included to help you implement these activities into your classroom.
**The only editable portion of this bundle is the Google Form™ exit ticket.**
Please download the preview to see more pictures. Read more about digital math activities and watch a video preview here.
What do I need to use these files? You and your students will need access to Google Slides™ and Google Forms™.
Can these be used in Microsoft Schools? Yes, you can download the Google Slide as a PowerPoint™ file and share with your students. The Google Forms do not require a login.
How will I access these files? These are created with a new feature by TpT. Once you purchase, TpT will ask for access to your Google Drive™ and will AUTOMATICALLY create a copy for you in your Google Drive™. If you have any trouble, then please reach out to TpT support.
Looking for additional Digital Math Activities? See our digital activity sets:
Ratios | Rates and Percents | Decimal Operations | The Number System | Fraction Operations | The Coordinate Plane | Expressions | Equations and Inequalities | Geometry | Statistics
Looking for complete math units for 6th Grade?
Unit 8: Equations and Inequalities
Unit 9: Geometry
Unit 10: Statistics
Looking for hands-on collaborative learning activities for 6th Grade?
Unit 8: Equations and Inequalities
Unit 9: Geometry
Unit 10: Statistics
Looking for more helpful teaching tips, ideas, and support? Check out Maneuveringthemiddle.com and join our online FB community MTM VIPS!
Try out a FREE math resource! Grab your freebie here!
Licensing:
This file is a license for ONE teacher and their students. Please purchase the appropriate number of licenses if you plan to use this resource with your team. Thank you!
Customer Service:
If you have any questions, please feel free to reach out for assistance. We aim to provide quality resources to help teachers and students alike, so contact me before leaving feedback if you have a need.
Maneuvering the Middle® Terms of Use
Products by Maneuvering the Middle®, LLC may be used by the purchaser for their classroom use only. This is a single classroom license only. All rights reserved. Resources may only be posted online in an LMS such as Google Classroom, Canvas, or Schoology. Students should be the only ones able to access the resources. It is a copyright violation to upload the files to school/district servers or shared Google Drives. See more information on our terms of use here.
If you are interested in a personalized quote for campus and district licenses, please click here.
©Maneuvering the Middle® LLC, 2012-present


