497 results
Statistics lessons for Microsoft PowerPoint
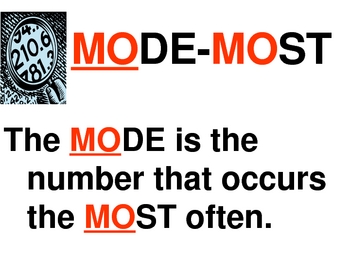
Statistics Mean, Median, Mode & Range Interactive PowerPoint by Erica
Introduce statistics including mean, median, mode and range with this colorful, interactive 22 slide PowerPoint. This interactive PowerPoint introduces each term and teaches a strategy for finding the value. There is also a trick or visual to help students remember the steps to find each one (mean, median, mode and range). Students are able to practice finding the mean, median, mode and range and then check within the PowerPoint. This is excellent for a statistics lesson or for students to e
Subjects:
Grades:
3rd - 6th
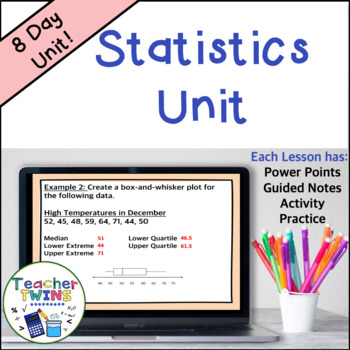
Statistics Unit - Mean Absolute Deviation - Populations and Samples - Box Plots
Make lesson planning easy with this no-prep Statistics - Mean Absolute Deviation - Populations and Samples - Box-and-Whisker Plots Unit! Included are 8 ready-made lessons to teach finding mean absolute deviation as well as interpreting and creating box-and-whisker plots. This unit is very easy to use and will save you a lot of time! Your students will learn how to find mean absolute deviation and interpret box-and-whisker plots by using our editable PowerPoints with guided notes. Students will l
Subjects:
Grades:
6th - 8th
Also included in: 7th Grade Math Curriculum Bundle

Box and Whisker Plot PPT and Guided Notes 6.SP.2 , 6.SP.4 , 6.SP.5
Box and Whisker Plot
This PPT lesson teaches students the vocabulary that goes with box and whisker plots as well as the steps for creating a box and whisker plot.
Along with the PPT are guided notes where students can answer questions while watching the PPT as well as the answer key. They also have the chance to create their own box and whisker plot. This is a great introductory lesson. This matches Common Core Standards for 6th grade, but could be adapted and used for other grades as we
Subjects:
Grades:
5th - 8th
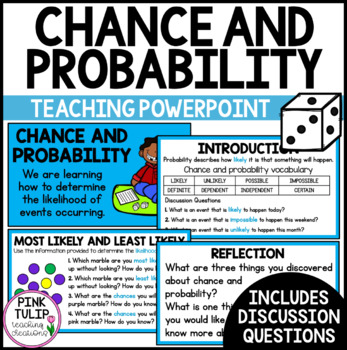
Chance and Probability - Teaching PowerPoint Presentation
Chance and Probability - Teaching PowerPoint PresentationCurriculum aligned PowerPoint presentation to guide explicit teaching of chance and probability, including likelihood. Includes:Learning intention.Introduction (tune in). Engaging graphics.Detailed explanations of various chance events.An in-depth vocabulary of terms such as likelihood, probability, chance, independent, dependent, and impossible.Discussion questions with answers.Reflection slides.Glossary. US spelling and UK spelling vers
Subjects:
Grades:
3rd - 5th
Also included in: Math PowerPoint Presentations Bundle
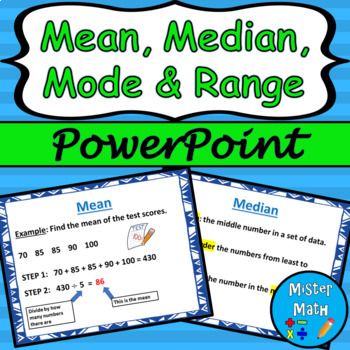
Mean, Median, Mode & Range PowerPoint Lesson
This is a PowerPoint Lesson to assist students in learning about finding the mean, median, mode, and range of data sets. The PowerPoint includes key vocabulary, as well as an example for each skill. Plenty of real-life examples are included to give students ample opportunities to connect the skills to the real world. The presentation also comes fully animated, with animations triggered by mouse click (or presentation pointer!)This PowerPoint lesson is also part of a BUNDLE that includes a guided
Subjects:
Grades:
3rd - 6th
Also included in: Mean, Median, Mode & Range PPT and Guided Notes BUNDLE
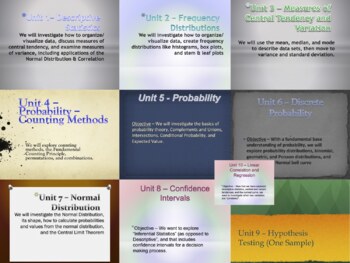
A Mountain of Statistics Curriculum - One Full Year Bundle
This is a bundle of 10 Units, Midterm Exam, & Final Exam designed for a high school Statistics Class (can be applied to University discipline). Each unit plan includes Common Core Standards, Key Concepts/Enduring Understandings, Essential Questions/Do Now, Activities, Resources, Procedures, and Assessment techniques. It is designed to be a lifelong tool that you can add to, edit, and re-use every year! Please see each Unit Statistics Product in the MountainWorks Store (sold separately) for
Subjects:
Grades:
9th - 12th, Higher Education
Sixth Grade Module 1 Lessons 1-15 (Compatible w/ Eureka Math)
*NOT COMPATIBLE WITH EUREKA TEXAS OR EUREKA SQUARED*This is a PowerPoint resource that will help guide you through the first 15 lessons of Module 1. It includes slides for each lesson with I Can Statements, Examples, Exercises, Lesson Summaries, Problem Sets, answers to independent work/Problem Sets, and Lesson Links (to keep you from having to scroll through other lessons to get to the one you need) for each lesson. These slides also include teacher prompts and questions for students. If you
Subjects:
Grades:
6th
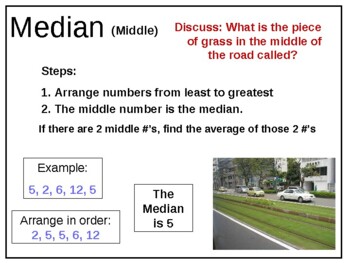
4th 5th 6th Grade Math Mean Median Mode Range MMMR Data Gr 4 5 6 Whole Numbers
This 16-slide Math PowerPoint introduces Mean, Median, Mode and Range and gives hints on how to remember each term. There are numerous practice problems as well. The numbers (data) used may be smaller than you desire, but the numbers are easily changeable and you'll still be able to use the examples. The last slide gives directions for a game to practice Mean, Median, Mode and Range using playing cards.
Subjects:
Grades:
4th - 6th
CCSS:
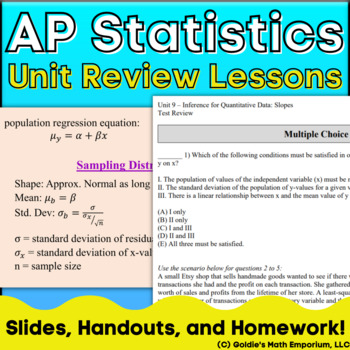
Goldie's AP® Statistics Review Lessons and Homework
AP StatisticsUnit Review Lessons and Homework Assignments You can use these resources:throughout your year in AP Statistics, as a way to review before quizzes and testsas end of the year AP Exam reviewas an independent study guide resource for students Note: These resources are included in their respective unit plans. You get a total of 21 individual resources in this amazing bundle. There are 9 units in the AP Statistics course, and each unit comes with the following:PowerPoint presentation rev
Subjects:
Grades:
11th - 12th
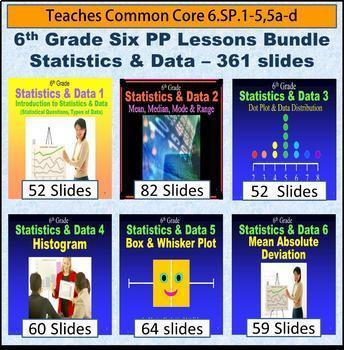
6th Grade Statistics & Data Bundle - 6 Powerpoint Lessons - 402 Slides
Sixth Grade Statistics and Data Bundle - It is composed of 6 different lessons comprising 402 slides on the following: Statistics and Data 1 - Statistical Questions and Types of Data, Statistics and Data 2 - Mean, Median, Mode & Range, Statistics and Data 3 - Dot Plot and Data Distribution, Statistics and Data 4 - Histogram, Statistics and Data 5 - Box and Whisker Plot, Statistics and Data 6 - Mean Absolute Deviation. For more information on these powerpoint lesson click on the individu
Subjects:
Grades:
6th
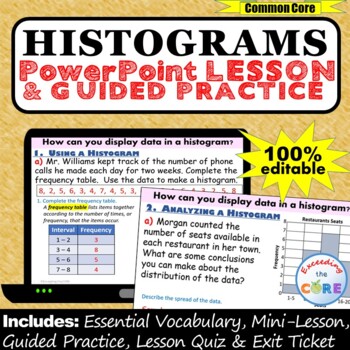
HISTOGRAMS and FREQUENCY TABLES PowerPoint Lesson AND Guided Practice - DIGITAL
Great for online learning and distance learning!Get your students successfully creating and using HISTOGRAMS and Frequency Tables with this PowerPoint Presentation. This lesson begins with a focused mini-lesson and guided practice questions. It concludes with a lesson quiz and exit ticket to assess student understanding. All of the answers are included. This PowerPoint presentation is 100% editable, therefore you can modify any slide as needed.What is Included:_ Mini-Lesson with Guided Practice
Subjects:
Grades:
6th - 8th
CCSS:
6th Grade Math -Probability and Statistics Bundle
6th Grade Math – Probability and Statistics Bundle - 9 LessonsThis COMPREHENSIVE bundle covers all of the 6th Grade Common Core Math Standards. This is a comprehensive unit so the teacher will only have to download the product and then print out copies with their students. This bundle is part of our 6th Grade Yearlong Math Curriculum. ABSOLUTELY NO PREP REQUIRED, just download and start teaching in minutes. Our preview product is an example of how each individual lesson in the unit is struct
Subjects:
Grades:
5th - 7th
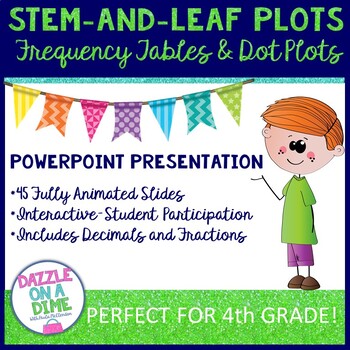
Stem and Leaf
Stem and Leaf Plots: This Stem and Leaf Presentation also includes Frequency Tables and Dot Plots appropriate for 4th grade TEKS Math standards. Stem and Leaf Plots are often very difficult for students to understand. This Stem and Leaf PowerPoint carefully constructs the key concepts for students to understand and develop new understandings. It also shows a visual comparison of Stem-and-Leaf Plots to Frequency Tables and Dot Plots. It contains examples of data using fractions and decimals t
Subjects:
Grades:
4th
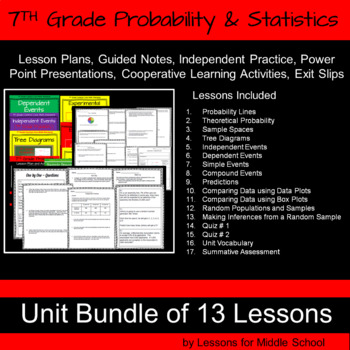
7th Grade Math - Probability and Statistics Bundle
This unit covers all of the 7th Grade Common Core Math Standards associated with Probability. This COMPREHENSIVE bundle has 13 Lessons with 429 Pages. ABSOLUTELY NO PREP REQUIRED, just download and start teaching in minutes. This unit is part of our 7th Grade Year Long Curriculum. INCLUDED WITH EACH LESSON➯Lesson Plan➯Power Point Presentation➯Warm Up Activity➯Guided Note➯Cooperative Learning Structure➯Independent Practice➯Exit Slip➯Answer Sheets included****************************************
Subjects:
Grades:
6th - 8th
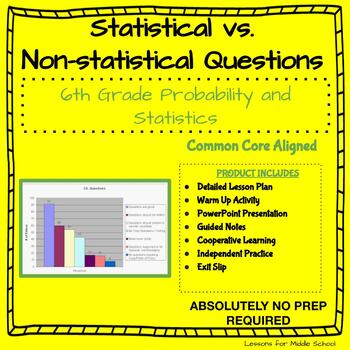
6th Grade Math Probability & Statistics-Statistical vs Non-Statistical Questions
This lesson focuses on asking Statistical vs Non-Statistical Questions. This lesson provides instruction and learning opportunities where students evaluate whether statements can be tested using statistics. Math CCSS 6.SP.1 is the focus - Recognize a statistical question as one that anticipates variability in the data related to the question and accounts for it in the answers. For example, “How old am I?” is not a statistical question, but “How old are the students in my school?” is a statisti
Subjects:
Grades:
5th - 7th
CCSS:
Also included in: 6th Grade Math -Probability and Statistics Bundle
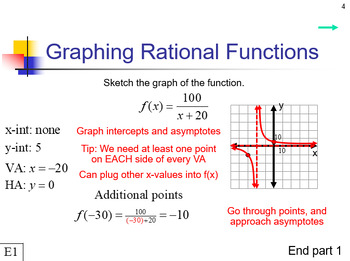
Algebra 2 Honors Course
Bundle of resources for an Algebra 2 Honors Course. Includes the following (note that all resources can be edited, equations may require MathType):8 Chapters (see this Course Page for the full breakdown and companion YouTube videos)1 Functions2 Factoring3 Complex Numbers4 Quadratics5 Polynomials6 Rational Functions7 Trigonometry8 Statistics and ProbabilityEach lesson includes:PowerPoint presentation for the lesson itselfWord Guided Notes to go with lessonWord handouts for two homework assignment
Subjects:
Grades:
9th - 12th
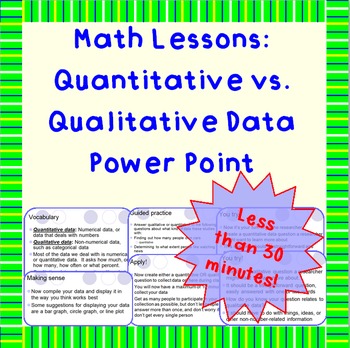
Qualitative vs. Quantitative Data - A Power Point Lesson
This short, 8-slide presentation is the perfect way to introduce your students to the difference between qualitative and quantitative data. Has vocabulary, guided practice, and an interactive piece where students create their own data collection question and then poll classmates. Students display the data in a format of their own choosing.
NOT CCSS-aligned
File is in .pptx (2010 Show) format.
If you decide to purchase, please leave me comments about this product. Thank you for your business
Subjects:
Grades:
6th - 8th
6th Grade Statistics & Data 5 - Box and Whisker Plot Powerpoint Lesson
Sixth Grade Statistics 5 - Box and Whisker Plot Powerpoint Lesson is powerful when used as direct instruction in the classroom, online or individually. It teaches students all the skills necessary to make a box and whisker plot: mean, median, lower quartile Q1, upper quartile Q3, inter quartile range, range, minimum and maximum numbers. Students then are shown how to take this information and build a box and whisker plot. Finally, students are taught how to analyze the box and whisker plot th
Subjects:
Grades:
6th, Adult Education
Also included in: 6th Grade Statistics & Data Bundle - 6 Powerpoint Lessons - 402 Slides
7th Grade Probability 2 - Compound Event Powerpoint Lesson
Seventh Grade Probability 2 - Compound Event Powerpoint Lesson is powerful when used as direct instruction in the classroom, on-line, or individually. It teaches the students to find the compound event three different ways: through multiplication, making a tree, and making a list using a table. The following probability terms are taught and reviewed: probability, event, trial, scale of probability, sample space, simple event, experiment, experimental probability. There are 22 effective teac
Subjects:
Grades:
7th
Basic Statistics Year Long Lesson Plan Bundle
Prepare to embark on an exhilarating journey through the realm of statistics with our meticulously crafted nine-lesson plan designed to engage and captivate your students' minds. Each session is a vibrant exploration of statistical concepts, infused with excitement, interactivity, and depth. From introducing the basics of data analysis to delving into advanced techniques, our lessons are brimming with hands-on activities, animated discussions, and real-world applications that will ignite a passi
Subjects:
Grades:
11th - 12th, Staff
Introduction to Factorials and Permutations Presentation, Notes & Practice
Focus of Lesson: Calculate factorials and use the permutation formula.
Lesson: Use the PowerPoint presentation with layered animation accompanied by a whole class discussion.
Alternate Lesson: Does your school have one-to-one computing? Have students view the presentation on their own device. This option allows students to proceed at their own pace and ask the teacher for clarification as needed.
Presentation: Slides 1-3
Student Note-taking Outline: Slides 4-5
20 Practice Problems: Slides
Subjects:
Grades:
8th - 12th, Higher Education
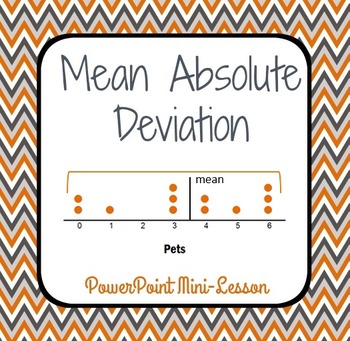
Mean Absolute Deviation - PowerPoint Mini Lesson Introduction
This PowerPoint mini-lesson introduces your students to the concept of the Mean Absolute Deviation (M.A.D.). It's presented in kid-friendly language, and it walks your students through the process, one step at a time. Most of the calculations use nice, whole numbers. The visual models will help your students understand the concept while they calculate this measure of variation.Check out the Preview file, so you understand what you're receiving on these 15 slides.Want a follow up activity here
Subjects:
Grades:
5th - 6th
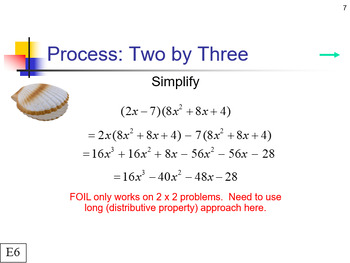
Algebra 2 CP Course
Bundle of resources for an Algebra 2 CP Course. Includes the following (note that all resources can be edited, equations may require MathType):8 Chapters (see this Course Page for the full breakdown and companion YouTube videos)1 Systems of Linear Equations2 Factoring3 Complex Numbers4 Quadratics5 Polynomials6 Rational Functions7 Trigonometry8 Statistics and ProbabilityEach lesson includes:PowerPoint presentation for the lesson itselfWord Guided Notes to go with lessonWord handouts for two homew
Subjects:
Grades:
9th - 12th
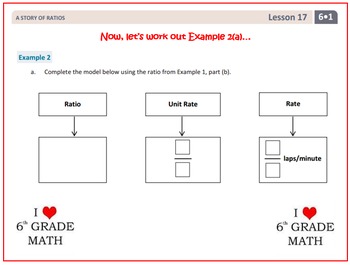
Sixth Grade Module 1 Lessons 16-29 (Compatible w/ Eureka Math)
*NOT COMPATIBLE WITH EUREKA TEXAS OR EUREKA SQUARED*This is a PowerPoint resource that will guide you through teaching Module 1 for 6th grade. It includes I Can Statements, Examples, Exercises, Lesson Summaries, Problem Sets/Answers, independent student problems' answer slides, and Lesson Links (to keep you from having to scroll through other lessons to get to the one you need). It also includes teacher prompts and student directions. If you purchase, be sure to preview lessons in Slide Show.
Subjects:
Grades:
6th
Showing 1-24 of 497 results


