8 results
Statistics homeschool curricula for Microsoft PowerPoint
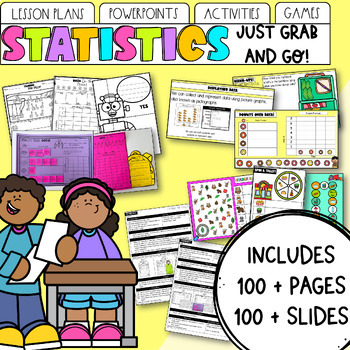
Statistics & Data | Maths Unit: Lessons, PowerPoint, Activities & Games
Looking for statistics and graphing planning that ticks all your boxes? Look no further! Teaching is hard enough, without spending hours creating differentiated lesson plans and activities. Not to mention the time spent planning what your early finishers can do, what assessment points to consider, or sourcing games that consolidate previous skills! With this Statistics and Data Unit, everything is done for you. Want to buy in early to the discounted bundle and get all updates for free? Find my G
Subjects:
Grades:
K - 2nd
Describe the Distribution of a Data Set
This Common Core statistics and probability lesson teaches students how to describe the distribution of a data set. The lesson includes research-based strategies and strategic questions that prepare students for Common Core assessments. In this lesson, students will describe the distribution of data sets. This lesson focuses on describing a variety of statistical distributions in different situations. Students are asked to describe different related data sets and describe what that means. In
Subjects:
Grades:
5th - 7th
Solve Percent Problems Using Proportions
This Common Core ratios and proportional relationships lesson covers how to solve multistep percent problems using proportions. The lesson includes research-based strategies and strategic questions that prepare students for Common Core assessments. In this lesson, students determine what the question is asking, and then the corresponding percent and quantity by drawing a diagram. Then, they set up a proportion for the percent and quantity, cross multiply, and solve for the unknown quantity. Fina
Subjects:
Grades:
6th - 8th
Types:
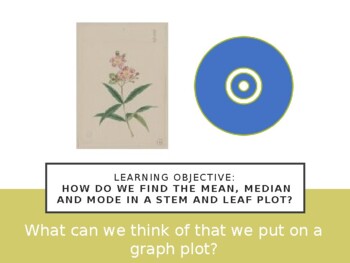
Mean, Median, and Mode, Stem & Leaf Plot
This visualized Power Point Presentation helps students to see how to find the mean, median, mode using graphics and charts. Step by step guided instructions.
Subjects:
Grades:
7th
Probability Review Marker Board Practice (Statistics/AP Statistics)
Get ready to supercharge your students' probability skills with this dynamic activity! Packed with 14 engaging review questions covering everything from 2 table probability to probability trees, independent events, dependent events, and mutually exclusive events, this activity is sure to keep your students on their toes. And with the answers conveniently provided on a PowerPoint presentation, you can easily post them on the board for quick and easy feedback. Perfect for Statistics and AP Statist
Subjects:
Grades:
9th - 12th
CCSS:
Introduction to Probability PowerPoint Presentation with practice
Learning Target:•I can determine the likelihood of an event happening.
Subjects:
Grades:
6th - 7th
Measures of Position – Quartiles and Percentiles (editable presentation)
Objectives of PPT (57 slides):To be able to find Quartiles, Percentiles, and Z-Scores.To be able to draw box plots.
Subjects:
Grades:
9th - 12th, Higher Education, Adult Education, Staff
Concept Summary Using the 1.5XIQR Rule for Outliers
This is a brief description of the concept of using the 1.5XIQR rule for outliers.
Subjects:
Grades:
9th - 12th, Higher Education
Showing 1-8 of 8 results


