49 results
Statistics scaffolded notes for Microsoft PowerPoint
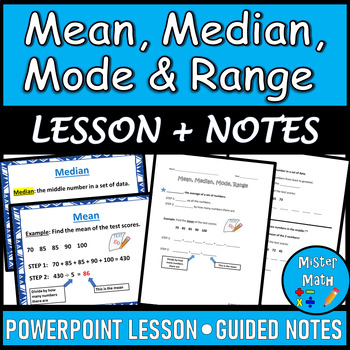
Mean, Median, Mode & Range PPT and Guided Notes BUNDLE
This Mean, Median, Mode & Range BUNDLE includes a PowerPoint Lesson and a corresponding Guided Notes Packet to assist students in learning about finding the mean, median, mode, and range of data sets. The PowerPoint and Guided Notes packet include key vocabulary, as well as an example for each skill. Additional practice problems are included that ask students to find the mean, median, mode and range of four data sets (for a total of 16 extra practice problems!) The presentation also comes fu
Subjects:
Grades:
3rd - 6th
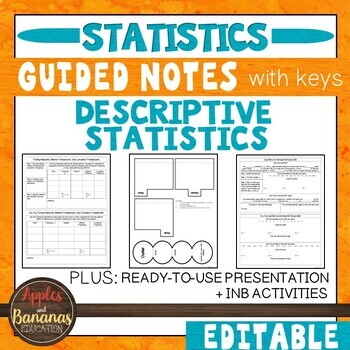
Descriptive Statistics- Guided Notes, Presentation, and INB Activities
This Introduction to Statistics product is flexible, editable, and can be used for in-person or distance learning. Take the time and stress out of creating your own guided notes and presentations. There are many ways to use this engaging bundle. It includes guided notes embedded with student practice problems (keys included), foldable activities, and a PowerPoint presentation for focused instruction. Choose what works best for your class/student and modify to make the content fit your needs. Not
Subjects:
Grades:
9th - 12th
CCSS:
Also included in: Custom Bundle for Viet

Box and Whisker Plot PPT and Guided Notes 6.SP.2 , 6.SP.4 , 6.SP.5
Box and Whisker Plot
This PPT lesson teaches students the vocabulary that goes with box and whisker plots as well as the steps for creating a box and whisker plot.
Along with the PPT are guided notes where students can answer questions while watching the PPT as well as the answer key. They also have the chance to create their own box and whisker plot. This is a great introductory lesson. This matches Common Core Standards for 6th grade, but could be adapted and used for other grades as we
Subjects:
Grades:
5th - 8th
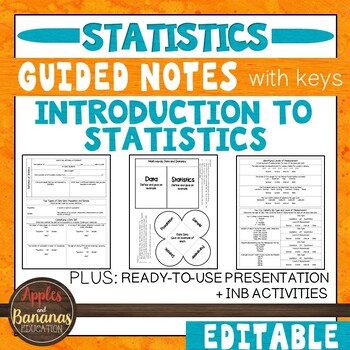
Introduction to Statistics - Guided Notes, Presentation, and INB Activities
This Introduction to Statistics product is flexible, editable, and can be used for in-person or distance learning. Take the time and stress out of creating your own guided notes and presentations. There are many ways to use this engaging bundle. It includes guided notes embedded with student practice problems (keys included), foldable activities, and a PowerPoint presentation for focused instruction. Choose what works best for your class/student and modify to make the content fit your needs. Not
Subjects:
Grades:
9th - 12th
CCSS:
Also included in: Custom Bundle for Viet
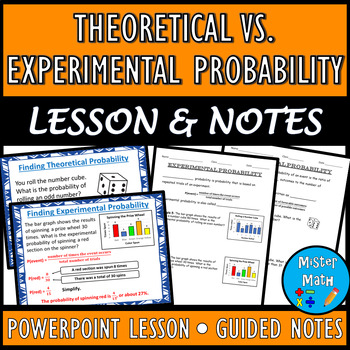
Theoretical vs. Experimental Probability PPT & Guided Notes BUNDLE
This BUNDLE includes a PowerPoint Lesson and a corresponding Guided Notes Packet to assist students in learning about theoretical and experimental probability. Students will learn the concepts of theoretical and experimental probability, as well as how to find the probabilities of each. Plenty of real-life examples are included to give students ample opportunities to practice the skills. Overall, the 21-slide PowerPoint and 6-page guided notes packet covers the following topics:Theoretical Proba
Subjects:
Grades:
6th - 9th
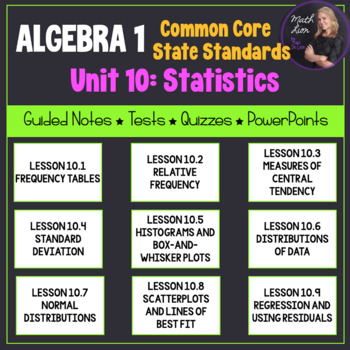
Statistics (Algebra 1 Curriculum - Unit 10) | Bundle for Common Core
This is a great unit that covers a Statistics unit in an Algebra 1 course! 9 lessons are included!All documents are EDITABLE!Included:- Overview of the common core alignment (PDF)- Guided notes for 9 lessons (PDF and Word)- PowerPoints that coordinate with the guided notes (PPTX)- Mid-Unit Quiz (PDF and Word)- Unit Test (PDF and Word)-Pacing Guide (PDF and Word)Each lesson contains a learning scale, warm up (do-now or bell ringer), key concepts, vocabulary, and examples for students to follow w
Subjects:
Grades:
7th - 12th
CCSS:
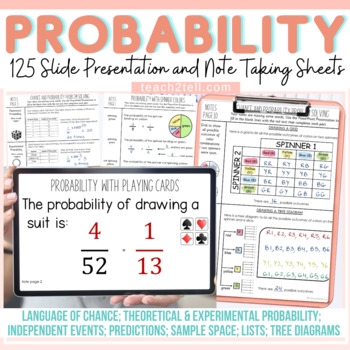
Chance and Probability Activities PowerPoint Presentations and Guided Notes
Are you teaching your students all about chance and probability and looking for fun hands-on probability activities? This Probability resource features 125 animated slides and 32 Cornell-style note-taking sheets to make abstract content on Chance and Probability more concrete.Your students will have a better understanding of theoretical probability, experimental probability, language of chance, sample space, predictions, lists, tree diagrams, and independent probability events.Both US and Britis
Subjects:
Grades:
4th - 8th
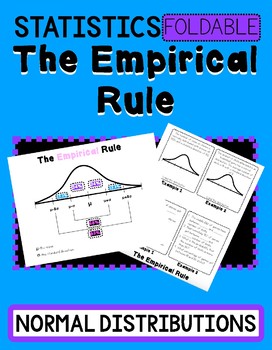
The Empirical Rule- Normal Distribution Foldable & Powerpoint
This resource is for the empirical rule. Students will label normal distributions with 2 real-world scenarios.This resource is accompanied by an animated Powerpoint and or Keynote file to present in the classroom. The presentation includes 8 additional examples. All answer keys are included.Printing:When printing the foldable set the printer to flip on the short side. You will fold the paper “hamburger” style just enough to show the title, The Empirical Rule.Sign up for my email list for freebie
Subjects:
Grades:
8th - 10th
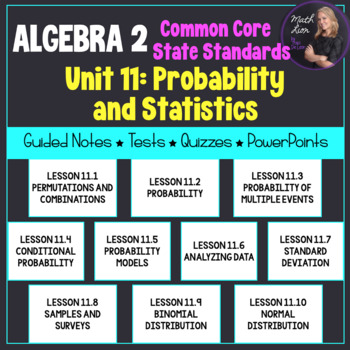
Probability and Statistics (Algebra 2 - Unit 11) | Math Lion
Documents are editable!!! This unit includes PowerPoint presentations, coordinated guided notes with answers, a mid-unit quiz, and unit test covering Probability and Statistics Functions. The PowerPoint includes warm ups (do-now or bell ringer), key concepts, and examples for students to follow. 10 lessons included! The lessons are 30 - 45 minutes each. 11.1: PERMUTATIONS AND COMBINATIONS 11.2: PROBABILITY 11.3: PROBABILITY OF MULTIPLE EVENTS 11.4: CONDITIONAL PROBABILITY 11.5: PROBABILITY MODEL
Subjects:
Grades:
9th - 12th
CCSS:
Also included in: Algebra 2 Unit Plans 9-12 (Bundled) | Math Lion
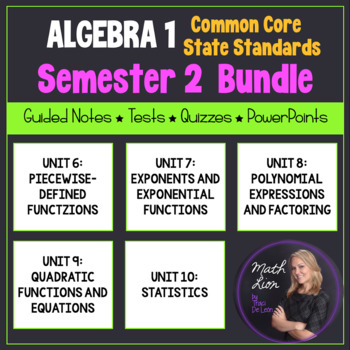
Algebra 1 Curriculum - Semester 2 EDITABLE Unit Plans | Bundled for Common Core
This is a great bundle that covers concepts for the second semester of an Algebra 1 course!Included:- Pacing guides with common core state standards (18-week guide) (PDF and Word)- Overview of the common core alignment (PDF)- Guided notes for 39 lessons (PDF and Word)- PowerPoint presentations (aligned with guided notes) (PPTX)-5 Mid-unit quizzes (PDF and Word)-5 Unit tests (PDF and Word)-Semester exam (PDF and Word)Each lesson contains a learning scale, warm up (do-now or bell ringer), key conc
Subjects:
Grades:
8th - 12th
CCSS:
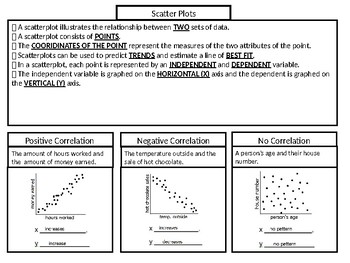
Scatter Plot Notes SOL 8.13
SOL 8.13 The student will a) represent data in scatterplots; b) make observations about data represented in scatterplots; and c) use a drawing to estimate the line of best fit for data represented in a scatterplot.
Subjects:
Grades:
6th - 8th
6th Grade Math INB MEGA BUNDLE (Interactive Notebook Series)
Looking for sixth grade math interactive notebook resources for the WHOLE YEAR? This mega bundle is for you! All activities included are LOW PREP and come with answer keys! Each blackline master included in this resource reduces paper use by providing materials for at least two (2) students and are perfectly sized for composition notebook use. Pricing will increase as the bundle is completed.WHAT'S INCLUDED:→ terms of use/how to use this product→ real-life photos of completed pages in a student
Subjects:
Grades:
5th - 7th
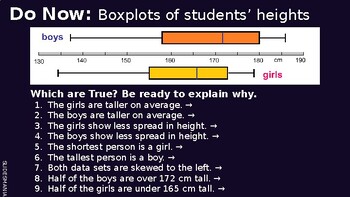
Displaying Data on Frequency Tables & Histograms Lesson Notes
This is a PowerPoint that can be used as notes for understating data on frequency tables and histograms. These notes are structured with a do now, and objective, followed by scaffolded examples and practice questions. These notes align with the EnVisions Math textbook for topic 8, lesson 4 but can be used separately as well!
Subjects:
Grades:
5th - 8th
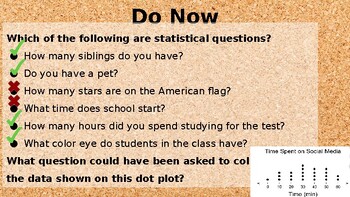
Calculating Mean, Median, Mode, and Range of a Data Set
This is a power point that can be used as notes when learning to calculate mean, median, mode, and range of a data set. These notes are structured with a do now, and objective, followed by scaffolded examples and practice questions. These notes align with the EnVisions Math textbook for topic 8, lesson 2 but can be used separately as well!
Subjects:
Grades:
5th - 8th
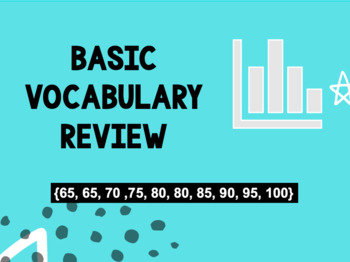
Vocabulary: Describing Data Distributions (Definitions & Example)
Includes an example throughout. Includes a review of common vocabulary including data displays: histograms, box plots, dot plots & comparing or describing data using mean, median, mode, range, spread, shape, etc. There is also an example at the end using Desmos. This is a PowerPoint that you can edit to fit your needs. You can also convert it to Google Slides or PDF. *Font used for titles: KG One More BIG
Subjects:
Grades:
5th - 12th, Higher Education, Staff
Introduction to Box Plots Lesson Notes
This is a PowerPoint that can be used as notes for an introduction to box plots. These notes are structured with an objective, followed by examples and practice questions. These notes align with the EnVisions Math textbook for topic 8, lesson 3 but can be used separately as well!
Subjects:
Grades:
5th - 8th

6th Grade *BUNDLE* Statistics and Probability Interactive Notebook Series
These sixth grade Statistics & Probability activities are LOW PREP and great for interactive notebooks! Each blackline master included in this resource reduces paper use by providing materials for at least two (2) students and are sized for composition notebook use.WHAT'S INCLUDED:→ terms of use/how to use this product→ real-life photos of completed pages in a student notebook→ learning standard with indicator of mastery for display→ answer key (for most activities)→ multiple activities for
Subjects:
Grades:
5th - 7th
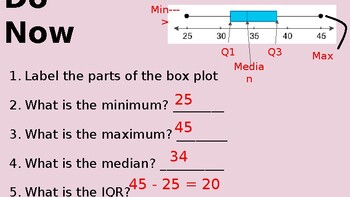
Interpreting Box Plots Lesson Notes
This is a power point that can be used as notes for interpreting box plots. These notes are structured with a do now, and objective, followed by scaffolded examples and practice questions. These notes align with the EnVisions Math textbook for topic 8, lesson 3 but can be used separately as well!
Subjects:
Grades:
5th - 8th
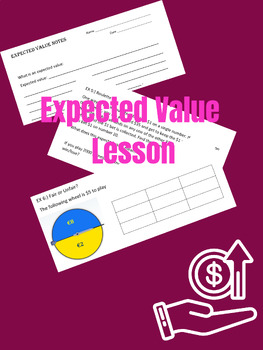
Expected Value Lesson
This is a completed lesson for expected value. Included is a PowerPoint and guided notes that go along with the slides. Students will go over multiple examples of expected values. At the end it, it relates expected value to the popular game show deal or no deal. Both the PowerPoint AND the guided notes have a link to the deal or no deal video clip used in this lesson.
Subjects:
Grades:
9th - 12th
Accuracy & Precision Presentation & Notes | Print | Digital | Distance Learning
Engage your students in more ways than before. With three differentiated notes options designed for a binder or an interactive notebook and a teacher-led or self-paced presentation, you have so many options to help your students master ACCURACY, PRECISION, PERCENT ERROR, and STANDARD DEVIATION. Also included are iPDF versions of the student notes that allow your students to complete their notes directly on the computer.Teacher-Led Presentation - Whether in a whole-group or small-group format, th
Subjects:
Grades:
8th - 11th
Also included in: Introduction to Science Presentations and Notes BUNDLE
Univariate Stats: Frequency Distribution Table, Animated PPT w/ Scaffolded Notes
This Univariate Stats: Frequency Distribution Table resource contains scaffolded note pages that correspond to an interactive PowerPoint for your scientific method or statistics unit. There is a Tip & Tricks slide and corresponding note page that compiles feedback, notes, and helpful information I have personally seen benefit my students.Please be aware that this lesson was designed for a criminal justice-based statistics course; as such, topics and applied word problems use related themes.P
Subjects:
Grades:
Not Grade Specific
CCSS:
NGSS:
HS-LS4-3

Math Doodle - Finding Probability Using a Table - Easy to Use Notes with PPT
7th Grade Math Doodle Sheet Product INCLUDES:Math Doodle Sheet - blank and keyGuided Practice Sheet - blank and keyPowerPoint – to show students the KEY– two versions of both sheets included: INB and large 8.5 x 11 size ALL TEKS Aligned– plan for the FULL year included with table of contents page for INB! SAVE BIG and buy the WHOLE YEAR SET found here:7th Grade Math Doodle Sheets ALL YEAR SET WHOLE YEAR SET List below:ALL TEKS Aligned– plan for the FULL year included! LIST of 88 Doodle Sheets p
Subjects:
Grades:
6th - 8th
Constants, Variables, & Level of Measurement Animated PPT w/ Scaffolded Notes
This constants, variables, and level of measurement resource contains an interactive and animated PowerPoint with matching scaffolded style notes for your scientific method or statistics unit. There is a Tip & Tricks slide and corresponding note page that compiles feedback, notes, and helpful information I have personally seen benefit my students.Please be aware that this lesson was designed for a criminal justice-based statistics course; as such, topics and applied word problems use related
Subjects:
Grades:
Not Grade Specific
CCSS:
NGSS:
HS-LS3-3
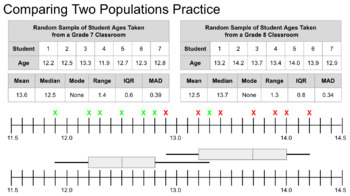
Grade 7 Statistics and Probability (Common Core/AERO) Presentations
This Bundle includes three Google Slide presentations.Each presentation addresses one of the Common Core/AERO standards for Grade 7 math in the domain of Statistics and Probability. Collectively, these presentations cover all grade 7 standards for statistics and probability as well as some of the 6th grade standards as review/scaffolding. The presentations were designed for these standards, but the content can be easily adapted to other courses.These presentations can be used to lecture but incl
Subjects:
Grades:
7th
Showing 1-24 of 49 results


