33 results
Statistics handouts for Microsoft PowerPoint

Chi Squared
Chi SquaredTeaching Chi Squared to a Stats class or AP Bio and not sure where to start?! Well, you found it. I created this product for my husband, who teaching AP Biology. This pack includes a PPT introduction, complete with student fill-in-the-blank notes, that walk students through the steps of Chi Squared and gives them a general overview of how and why we use this test. Degrees of Freedom are explained, as well as p-value. Notes provide an additional practice problem to do as a class. This
Subjects:
Grades:
9th - 12th
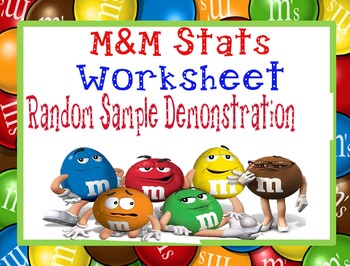
Psychology Random Sample Population Stats M&M Worksheet for Research Methods
Psychology or Statistics Random Sample & Population Statistics M&Ms Worksheet Activity for Research Methods includes a teacher direction sheet with materials that you need and how to complete the activity along with printable handout for students. *Student Favored activity*Please email me with any questions at ReadySetLearnSocialScience@yahoo.comIf you would like to get updates on NEW and CURRENT resources...►FOLLOW Me on Teachers Pay Teachers►FOLLOW Me on Pinterest►FOLLOW Me on Instagr
Subjects:
Grades:
4th - 12th, Adult Education
Types:

Algebra 2 - Growing BUNDLE of Lessons
Here is our growing list of lessons for Algebra 2 Curriculum. Each lesson format includes the following:Warm Up ActivityStudent Self-Assessment of UnderstandingDirect Instruction – Power Point PresentationStudent Guided NotesCooperative Learning ActivityIndependent Practice ActivityExit SlipSequences and Series UnitLesson # 1 - Sequences and Partial SumsLesson # 2 - Arithmetic SequencesLesson # 3 - Geometric SequencesLesson # 4 - Geometric SeriesLesson # 5 - Counting PrinciplesLesson # 6 - Prob
Subjects:
Grades:
10th - 12th
Mean, Median, Mode, Range and Standard Deviation Summary
I use this MS PowerPoint presentation file to kickoff our study of Statistics in my 9th grade Math I or Algebra I classes. It reviews the definitions and detailed methods required to calculate the mean, median, mode, range and standard deviation of a data set(s). It is a totally animated ppt file and very easy for students to understand. Any of the ppt animations can be modified as desired by the presenter (teacher). It also includes 2 example problems for the students to complete at the en
Subjects:
Grades:
8th - 9th
CCSS:
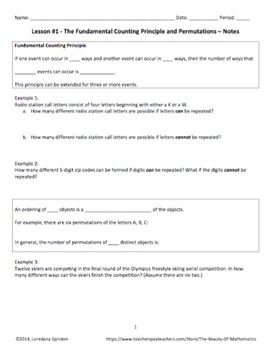
Probability and Statistics Units Bundle
This bundle includes both of my Probability Unit and my Statistics Unit (taught in Algebra 1, Algebra 2, or Statistics), also sold separately below:https://www.teacherspayteachers.com/Product/Statistics-Unit-2006021https://www.teacherspayteachers.com/Product/Probability-Unit-2006028Please check the links above for details about each unit. Buy the two units together and save!
Subjects:
Grades:
8th - 12th

Mission 2: Backwards Averaging
This packet asks students to go on a mission to help the monsters at Peace University know where best to spend their time studying for exams. Three monsters reveal the grades they have made in each of their four classes and ask the student to find out what is the minimum grade they would need to make on each subject's exam in order to get a 90% (an A) in all of their classes.As part of the instructions for the quest, a secret for solving these types of problems is revealed. As it is explained
Subjects:
Grades:
6th, Adult Education
Types:
CCSS:
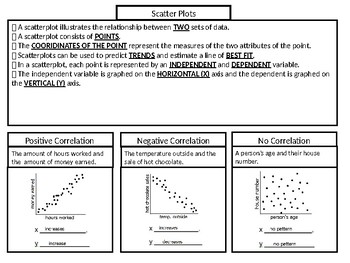
Scatter Plot Notes SOL 8.13
SOL 8.13 The student will a) represent data in scatterplots; b) make observations about data represented in scatterplots; and c) use a drawing to estimate the line of best fit for data represented in a scatterplot.
Subjects:
Grades:
6th - 8th
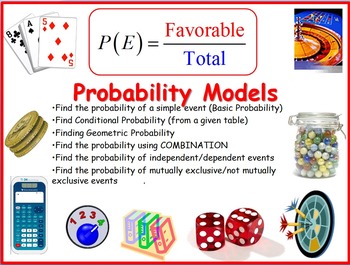
Probability Models
This handout drills the understanding of the different models of probability. Student would have to first determine under which model should this problem fit, then, apply the appropriate strategy to answer the questions. There are many ways to answer each of the questions provided in this handout. I provided "An" answer key.
In this handout, you will find a set of 40 questions on the following probability models:
1. Detailed visual description of the Standard Deck of Cards
2. Basic Probab
Subjects:
Grades:
6th - 12th, Higher Education, Adult Education, Staff
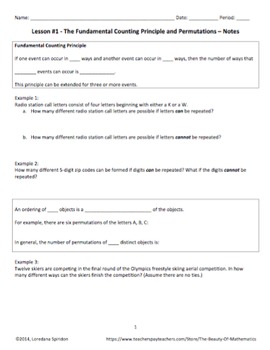
Probability Unit - PowerPoints & Notes (5 complete lessons)
This unit is perfect as a Probability Unit in an Algebra 1, Algebra 2, or Statistics course. It is composed of 5 detailed lessons, with practice for students. Each lesson contains a student packet with fill-in-the-blank notes followed by practice exercises. Each notes packet is accompanied by a PowerPoint presentation which includes all the information in the students’ notes packet, including the examples and all solutions. The following files are included with this purchase:Notes packets (with
Subjects:
Grades:
8th - 12th
Also included in: Probability and Statistics Units Bundle
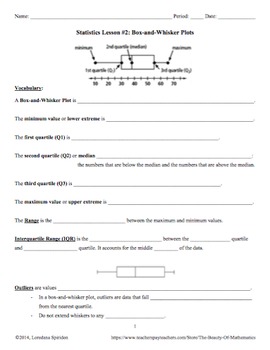
Statistics Unit - PowerPoints & Notes (5 complete lessons)
This unit is perfect as an Introductory Statistics Unit in an Algebra 1, Algebra 2, or Statistics course. It is composed of 5 detailed lessons, with plenty of practice for students. Each lesson contains a student packet with fill-in-the-blank vocabulary words followed by exercises. The vocabulary words and diagrams are also included in PowerPoint presentations (one for each lesson) for students to copy from.The following files are included with this purchase:Student packets (with Vocabulary and
Subjects:
Grades:
8th - 12th
Also included in: Probability and Statistics Units Bundle
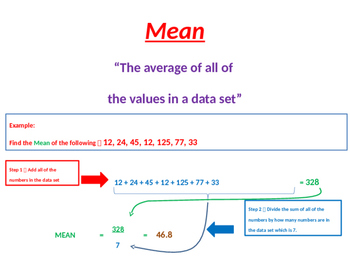
General Statistics - Mean, Median, Mode, Range and Mean Absolute Deviation
I use this MS PowerPoint presentation file to kickoff our study of Statistics in my 7th and 8th grade math classes. It reviews the definitions and detailed methods required to calculate the mean, median, mode, range and mean absolute deviation (MAD) of a data set(s). It is a totally animated ppt file and very easy for students to understand. Any of the ppt animations can be modified as desired by the presenter (teacher). It also includes 2 example problems for the students to complete towar
Subjects:
Grades:
7th - 8th
CCSS:
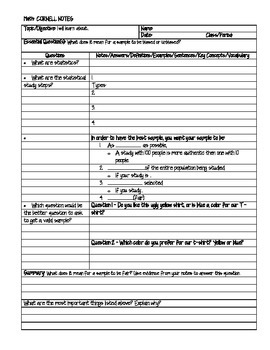
Statistical Sampling Lesson CCSS 7.SP.A.1 | Distance Learning
This includes PowerPoint Presentation and Guided Notes for CCSS 7.SP.A.1. Thank you for visiting my store.
CCSS.Math.Content.7.SP.A.1
Understand that statistics can be used to gain information about a population by examining a sample of the population; generalizations about a population from a sample are valid only if the sample is representative of that population. Understand that random sampling tends to produce representative samples and support valid inferences.
Subjects:
Grades:
7th
Understanding the Basics of Statistics - Unit 1 Notes PowerPoint
This product contains three sections of complete notes in the form of powerpoint slides. There are over 70 slides worth of content that include learning objectives, calculator tutorials, example problems, key vocabulary, and discussion prompts!
Understanding the Basics Slideshows:
Section 1.1 - What is Statistics?
Section 1.2 - Random Sampling + TI84 Tutorial Handout!
Section 1.3 - Experimental Design
In this unit you will find content related to Qualitative vs. Quantitative Variables, Level
Subjects:
Grades:
8th - 12th
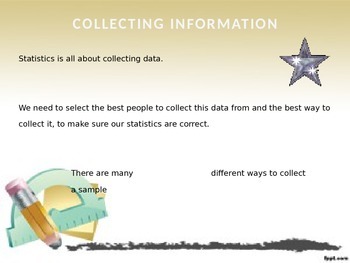
Statistics Sampling Powerpoint Presentation
This powerpoint was created to help students understand the different types of statistical sampling.
Including
- Statistics is all about collecting information
- Random sampling and the population
- The definition of a sample
- What an accurate sample vs a biased sample is
- Four commonly used random sampling techniques
- Simple Random Sampling
- Systematic Sampling
- Cluster Sampling
- Stratified Random Sampling
Subjects:
Grades:
8th - 12th
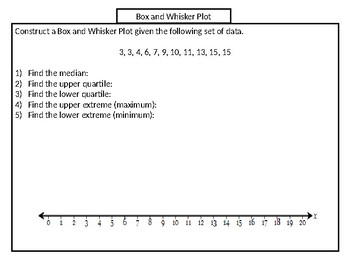
Box-and-Whisker Plot Notes SOL 8.12
SOL 8.12 The student will a) represent numerical data in boxplots; b) make observations and inferences about data represented in boxplots; and c) compare and analyze two data sets using boxplots.
Subjects:
Grades:
6th - 8th
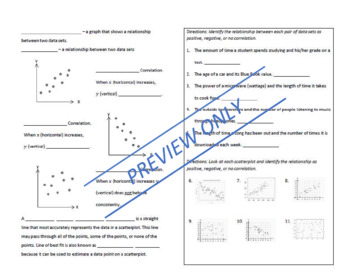
Scatterplots and Correlation (PowerPoint and Guided Notes)
This is a presentation on scatterplots that I made for my 8th grade class. There are accompanying guided notes and practice questions. -----------------------------------------------------------------This item is a paid digital download from my Teachers-pay-Teachers store. This item is bound by U.S. and International copyright laws. Redistributing, editing, selling, or posting this item (or any part thereof) on the internet are all strictly prohibited without prior permission from the author. Vi
Subjects:
Grades:
6th - 9th
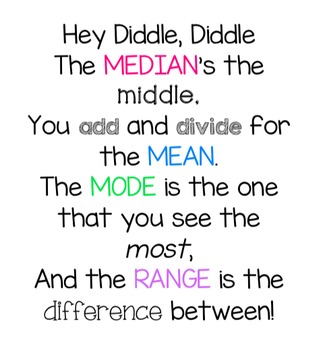
Landmark Numbers - BUNDLE
This bundle includes the Mean, Median, Mode, and Range file as well as the Student Games file found in my store. This is everything you need for an introduction to your statistics unit! Includes a 32-slide PowerPoint (with animation) that explains each calculation with whole-class practice and independent practice problems. Also includes a student handout for finding each landmark number, as well as four partner games (with teacher and student directions and materials lists). Engage your student
Subjects:
Grades:
5th - 6th
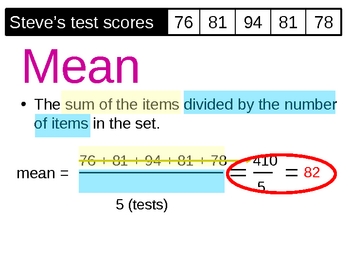
mean, median, mode AND MORE!!!!!!!!!
Powerpoint presentation that covers Mean, Median, Mode, Range, outliers, additional data & the most useful measure.
CA standards: SDAP 1.1 - 1.4
Subjects:
Grades:
4th - 12th
Standard Deviation - PowerPoint and Student Resource (distance learning)
In this bundle are included a PowerPoint which explains how to determine standard deviation without and with a graphing calculator. Students are led through examples with step by step directions for both cases. Additionally, the bundle includes student notes on finding standard deviation (with and without a graphing calculator) and a student exercise which mirrors the examples found in the PowerPoint.
Subjects:
Grades:
8th - 10th
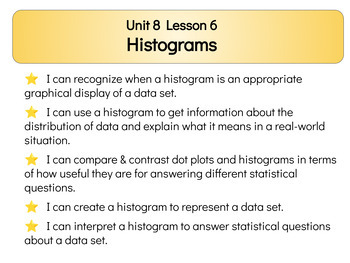
Illustrative Math Grade 6 Unit 8 Lesson 6 Histograms
Scaffolded slides that can be used easily with Nearpod or Classkick, to be printed, or to support lesson learningPreview of how it could be used in Nearpod: https://app.nearpod.com/?pin=17EA1970CE9EBA9FC87FD9F4F18C8A67-1&&utm_source=linkCreated from a free open source math curriculum: https://access.openupresources.org/curricula/our6-8math/en/grade-6/unit-8/lesson-4/index.htmlGrade 6 Unit 1 Lesson 5 Bases & Heights of ParallelogramsGrade 6 Unit 1 Lesson 8 Area of TrianglesGrade 6 Uni
Subjects:
Grades:
6th
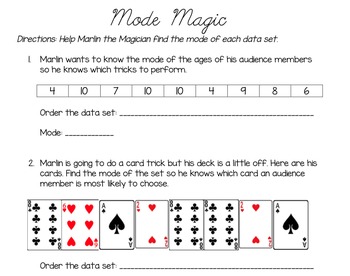
Mean, Median, Mode, and Range
This zipped file contains everything you need to teach an introductory unit on finding landmark numbers. A powerpoint with whole-group examples and independent review with animated slides will engage your students. The real-world context handouts will also get students excited about calculating mean, median, mode, and range of data sets. Answer keys are not included.
Subjects:
Grades:
5th - 6th
CCSS:
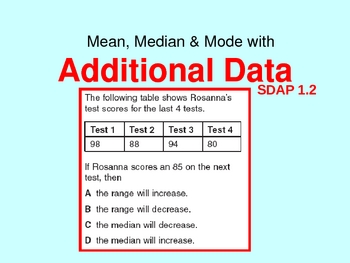
How does additional data affect the mean, median and mode?
How does additional data affect the mean, median and mode? This powerpoint will walk you through the process to see what happens.
CA standard: SDAP 1.2
Subjects:
Grades:
5th - 12th
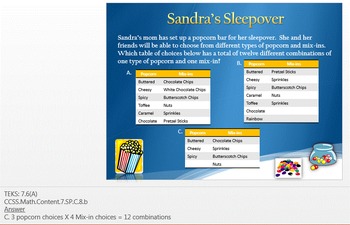
7th Grade Wintertime Work the Words (WtW): Probability
These 5 Wintertime 2-variable relationship word problems (Work the Words, or, WtW) are labeled with both TEKS and Common Core State Standards and formatted for custom problem-solving models. They provide challenging and rigorous practice in solving math problems for the STAAR® (State of Texas Assessments of Academic Readiness) and are based on the latest released STAAR® test for 7th grade.
Contents
*Powerpoint presentation with a slide for each problem with themed color illustrations. The Notes
Subjects:
Grades:
7th
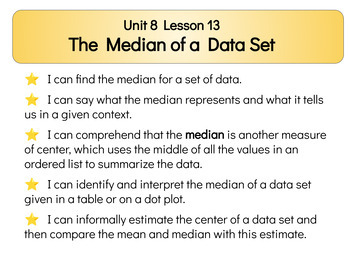
Illustrative Math Grade 6 Unit 8 Lesson 13 The Median of a Data Set
Scaffolded slides that can be used easily with Nearpod or Classkick, to be printed, or to support lesson learningPreview of how it could be used in Nearpod: https://app.nearpod.com/?pin=927C09D1DDF1344741B179876135D634-1&&utm_source=linkCreated from a free open source math curriculum: https://access.openupresources.org/curricula/our6-8math/en/grade-6/unit-8/lesson-13/index.htmlGrade 6 Unit 1 Lesson 5 Bases & Heights of ParallelogramsGrade 6 Unit 1 Lesson 8 Area of TrianglesGrade 6 Un
Subjects:
Grades:
6th
Showing 1-24 of 33 results


