8 results
Statistics simulations for Microsoft PowerPoint
Mean Absolute Deviation
This 25-slide PowerPoint presentation describes what Mean Absolute Deviation is and how to calculate it. The lesson uses two sets of sample data that turn out to have the same mean & median and a common range. Mean absolute deviation is introduced as another measurement that will show the difference in the two data sets. The presentation is designed to have students work with the sample data as well so they can learn as they go along. Content is based on common core standard CCSS.Math.Conten
Subjects:
Grades:
6th
CCSS:

Data Handling: Traffic Nightmare Tally and Bar Charts Project
A fantastic and very comprehensive resource including a Traffic Nightmare project book, lesson plan, student objective sheets, PowerPoint extended data collection exercise, PowerPoint Tally Chart Bingo, student bingo sheet and a PowerPoint introduction to using tally charts.
This project focuses on a scenario where the opening of a local supermarket has resulted in a great increase in heavy traffic through a residential area. The students tally the vehicles they see on screen to 'prove' the incr
Subjects:
Grades:
Not Grade Specific

2 Dice Probability Bingo Game
Simple Bingo game where students can use a bingo game as an experiment to discover which values are the highest probability in either the sum of 2 dice or the difference of 2 dice.
Students fill in the sheets with values they think will come up. They get to fill in one square per round if the have a value that matches the sum/difference of the dice. After the first game is played, it should be played again to allow students to use their understanding to improve their chances. Eg. using more
Subjects:
Grades:
5th - 8th
Types:
Numeric Data: Box Plots
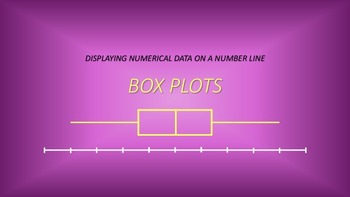
This 29-slide PowerPoint presentation covers the basics of Box Plots in good detail. The lesson is based on math Common Core standard CCSS.Math.Content.6.SP.B.4 under the domain of Statistics and Probability. It begins with a review on number lines. The purpose & components of Box Plots are discussed next. Then, using sample data, it takes you step through step in determining the 5-number summary and constructing the Box Plot. This lesson could be used for a full class period. I recommend th
Subjects:
Grades:
6th
CCSS:
Probability
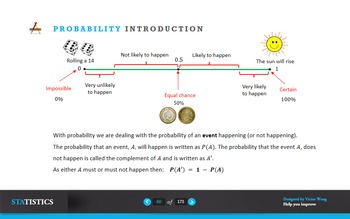
• evaluate probabilities in simple cases by means of enumeration
of equiprobable elementary events (e.g. for the total score when
two fair dice are thrown), or by calculation using permutations or
combinations;
• use addition and multiplication of probabilities, as appropriate, in
simple cases;
• understand the meaning of exclusive and independent events,
and calculate and use conditional probabilities in simple cases,
e.g. situations that can be represented by means of a tree diagram.
Subjects:
Grades:
Higher Education, Staff
Binomial Distribution
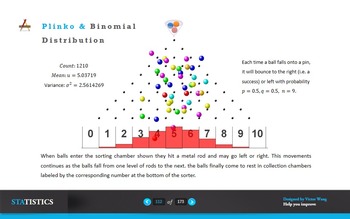
• use formulae for probabilities for the binomial distribution, and
recognise practical situations where the binomial distribution is a
suitable model (the notation B(n, p) is included);
• use formulae for the expectation and variance of the binomial
distribution.
Subjects:
Grades:
10th - 12th, Higher Education, Staff
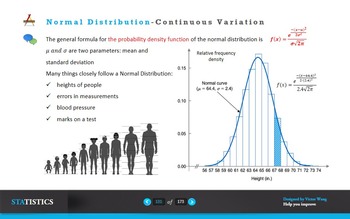
Normal Distribution
1)understand the use of a normal distribution to model a continuous
random variable, and use normal distribution tables;
solve problems concerning a variable X, where X ~ N, including:
finding the value of P(X > x1), or a related probability, given the
values of x1,
2)finding a relationship between x1, and given the value of
P(X > x1) or a related probability;
3)recall conditions under which the normal distribution can be used
as an approximation to the binomial distribution (n large enou
Subjects:
Grades:
10th - 12th

Mean Absolute Deviation
A concrete explanation for the topic of mean absolute deviation. Uses Microsoft Power Point with an animation to help students develop the abstract idea in statistics that is mean absolute deviation. I created this for my 6th graders and the idea just clicked with them after this explanation. Can be accompanied with a youtube video of Good Mythical Morning where Rhett and Link play taste test games and throw dart for their guesses.
Subjects:
Grades:
6th - 7th
Showing 1-8 of 8 results


