162 results
8th grade statistics lessons for Microsoft PowerPoint
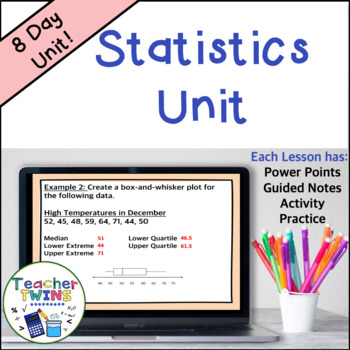
Statistics Unit - Mean Absolute Deviation - Populations and Samples - Box Plots
Make lesson planning easy with this no-prep Statistics - Mean Absolute Deviation - Populations and Samples - Box-and-Whisker Plots Unit! Included are 8 ready-made lessons to teach finding mean absolute deviation as well as interpreting and creating box-and-whisker plots. This unit is very easy to use and will save you a lot of time! Your students will learn how to find mean absolute deviation and interpret box-and-whisker plots by using our editable PowerPoints with guided notes. Students will l
Subjects:
Grades:
6th - 8th
Also included in: 7th Grade Math Curriculum Bundle

Box and Whisker Plot PPT and Guided Notes 6.SP.2 , 6.SP.4 , 6.SP.5
Box and Whisker Plot
This PPT lesson teaches students the vocabulary that goes with box and whisker plots as well as the steps for creating a box and whisker plot.
Along with the PPT are guided notes where students can answer questions while watching the PPT as well as the answer key. They also have the chance to create their own box and whisker plot. This is a great introductory lesson. This matches Common Core Standards for 6th grade, but could be adapted and used for other grades as we
Subjects:
Grades:
5th - 8th
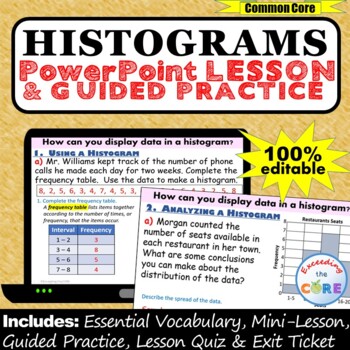
HISTOGRAMS and FREQUENCY TABLES PowerPoint Lesson AND Guided Practice - DIGITAL
Great for online learning and distance learning!Get your students successfully creating and using HISTOGRAMS and Frequency Tables with this PowerPoint Presentation. This lesson begins with a focused mini-lesson and guided practice questions. It concludes with a lesson quiz and exit ticket to assess student understanding. All of the answers are included. This PowerPoint presentation is 100% editable, therefore you can modify any slide as needed.What is Included:_ Mini-Lesson with Guided Practice
Subjects:
Grades:
6th - 8th
CCSS:
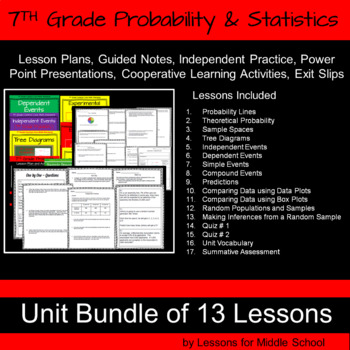
7th Grade Math - Probability and Statistics Bundle
This unit covers all of the 7th Grade Common Core Math Standards associated with Probability. This COMPREHENSIVE bundle has 13 Lessons with 429 Pages. ABSOLUTELY NO PREP REQUIRED, just download and start teaching in minutes. This unit is part of our 7th Grade Year Long Curriculum. INCLUDED WITH EACH LESSON➯Lesson Plan➯Power Point Presentation➯Warm Up Activity➯Guided Note➯Cooperative Learning Structure➯Independent Practice➯Exit Slip➯Answer Sheets included****************************************
Subjects:
Grades:
6th - 8th
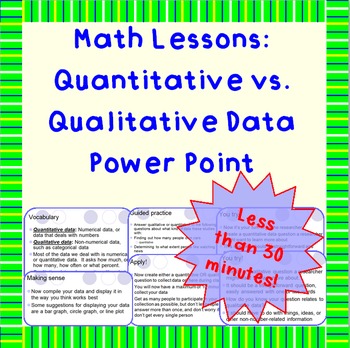
Qualitative vs. Quantitative Data - A Power Point Lesson
This short, 8-slide presentation is the perfect way to introduce your students to the difference between qualitative and quantitative data. Has vocabulary, guided practice, and an interactive piece where students create their own data collection question and then poll classmates. Students display the data in a format of their own choosing.
NOT CCSS-aligned
File is in .pptx (2010 Show) format.
If you decide to purchase, please leave me comments about this product. Thank you for your business
Subjects:
Grades:
6th - 8th
Introduction to Factorials and Permutations Presentation, Notes & Practice
Focus of Lesson: Calculate factorials and use the permutation formula.
Lesson: Use the PowerPoint presentation with layered animation accompanied by a whole class discussion.
Alternate Lesson: Does your school have one-to-one computing? Have students view the presentation on their own device. This option allows students to proceed at their own pace and ask the teacher for clarification as needed.
Presentation: Slides 1-3
Student Note-taking Outline: Slides 4-5
20 Practice Problems: Slides
Subjects:
Grades:
8th - 12th, Higher Education
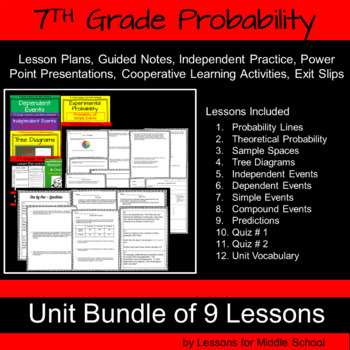
7th Grade Math - Probability Bundle
This unit covers all of the 7th Grade Common Core Math Standards associated with Probability. This COMPREHENSIVE bundle has 9 Lessons with 300+ Pages. ABSOLUTELY NO PREP REQUIRED, just download and start teaching in minutes. This unit is part of our 7th Grade Year Long Curriculum.INCLUDED WITH EACH LESSON➯Lesson Plan➯Power Point Presentation➯Warm Up Activity➯Guided Note➯Cooperative Learning Structure➯Independent Practice➯Exit Slip➯Answer Sheets included*******************************************
Subjects:
Grades:
6th - 8th
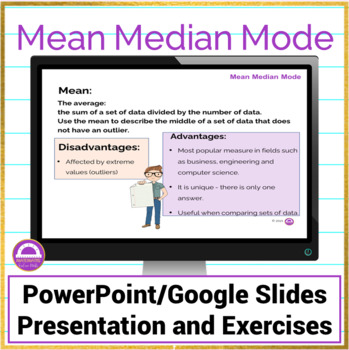
Mean Median Mode Notes and Activities
Make teaching Mean Median and Mode easy with this super engaging digital Teacher Presentation and printable Student notes! Perfect for both In Person and Distance Learning, this resource has everything you need to give your students a solid foundation with examples and class practice exercises during the presentation.This resource includes:Teacher Presentation in both Google Slides and PowerPoint that provides colorful visuals illustrating concepts along with examples;A pdf greyscale version of
Subjects:
Grades:
5th - 8th
Also included in: Bundle Statistics and Probability | 50% Discount
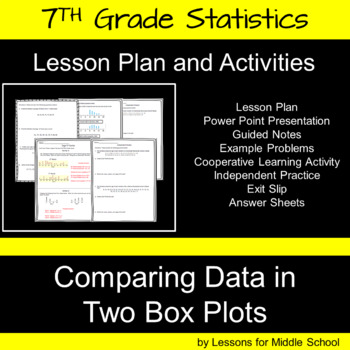
7th Grade Math - Statistics - Comparing Data in Two Box Plots (CCSS Aligned)
This lesson focuses on teaching students to compare data shown in two box plots according to the 7th Grade Common Core Math Standards. Students will be presented with data displayed in two box plots and students must use their understanding of the following to compare the data presented. ➯Maximum Values ➯Minimum Values ➯Median ➯Interquartile ➯Outliers ABSOLUTELY NO PREP REQUIRED, just download and start teaching in minutes. Students will compare the shap
Subjects:
Grades:
6th - 8th
CCSS:
Also included in: 7th Grade Math - Probability and Statistics Bundle
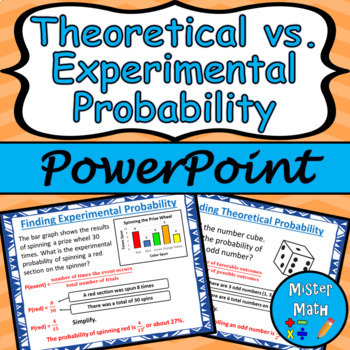
Theoretical vs. Experimental Probability PowerPoint Lesson
This is a PowerPoint Presentation to assist students in learning about theoretical and experimental probability. Students will learn the concepts of theoretical and experimental probability, as well as how to find the probabilities of each. Overall, the 21-slide PowerPoint Lesson covers the following topics:Theoretical ProbabilityUsing Theoretical ProbabilityExperimental ProbabilityMaking PredictionsComparing Theoretical & Experimental Probability Plenty of real-life examples are included to
Subjects:
Grades:
6th - 9th
Also included in: Theoretical vs. Experimental Probability PPT & Guided Notes BUNDLE
Relative Frequency Probability PowerPoint Lesson - Distance Learning
This 14-page editable PowerPoint lesson covers understanding relative frequency probability, how to calculate it, the difference between theoretical probability and relative frequency, and applications of relative frequency. Multiple examples, a student partner activity, and “Your Turn” slide ensures that students have a firm understanding of the lesson before moving on. This PowerPoint is formatted for widescreen display. The cover page was reformatted to make viewing easier when searching f
Subjects:
Grades:
6th - 9th
Also included in: Middle School Math PowerPoint Bundle - Distance Learning
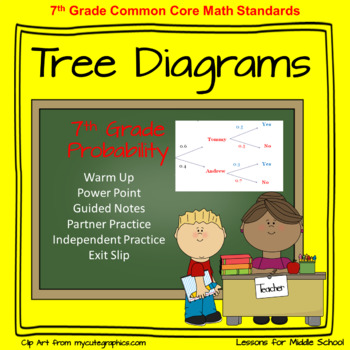
7th Grade Math - Probability -Tree Diagrams
This lesson teaches students how to use Tree Diagrams to represent visually all of the possible outcomes for independent and dependent events. Students will examine problem sets and work with their teammates to solve problems regarding the probability of events occurring by using Tree Diagrams to visually represent all of the possible outcomes. Students will learn specific methods on how to multiply or add probabilities to solve for specific events. Example Problem:What are all of the possibl
Subjects:
Grades:
6th - 8th
Also included in: 7th Grade Math - Probability and Statistics Bundle

Algebra 2 - Sequences and Series Unit - 6 Complete Lessons and Test
Everything you need to guide your students is right here - ready to use. Introducing our comprehensive Algebra 2 bundle on the topic of Sequences and Series! This bundle includes a wide range of lessons and materials designed to help students master the key concepts and skills related to this important topic.Inside this bundle, you'll find a variety of engaging and interactive lessons, direct instruction examples, practice problems, and assessments. Our lessons are designed to be accessible to s
Subjects:
Grades:
8th - 11th
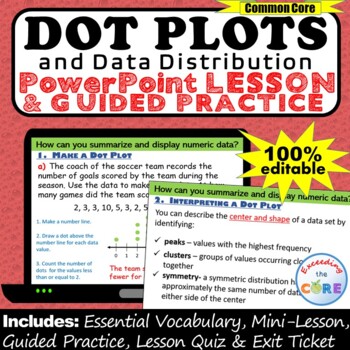
DOT PLOTS, LINE PLOTS & DATA DISTRIBUTION PowerPoint Lesson & Practice | Digital
Great for online learning and distance learning!Get your students successfully creating and using DOT PLOTS /LINE PLOTS and Data Distribution with this PowerPoint Presentation. This lesson begins with a focused mini-lesson and guided practice questions. It concludes with a lesson quiz and exit ticket to assess student understanding. All of the answers are included. This PowerPoint presentation is 100% editable, therefore you can modify any slide as needed.What is Included:_ Mini-Lesson with Gui
Subjects:
Grades:
6th - 8th

Statistics Module Bundle
Dear Customers!This Statistics Module Bundle file contains 18 lectures which are covered during Statistics Module.Each lecture containing:- Lecture PPT- Test Bank with answers for each lecture - Exercises for seminars/lectures with answers
Subjects:
Grades:
6th - 12th, Higher Education, Adult Education, Staff
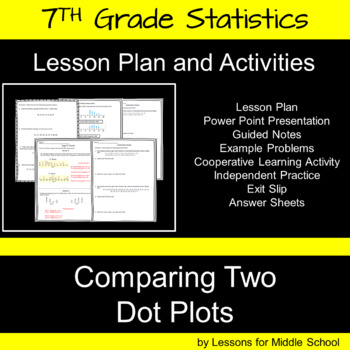
7th Grade Math -Statistics- Comparing Data Shown in Dot Plots
This lesson teaches students how to Compare Data Shown in Two Dot Plots according to the 7th Grade Common Core Math Standards. Students will be presented with data displayed in Dot Plots and students must use measures of central tendency to compare the data to formulate conclusions. Students will examine the spread or statistical range of the data, the center or median, and then they will examine the overall shape of the two dot plots. ABSOLUTELY NO PREP REQUIRED, just download and start teac
Subjects:
Grades:
6th - 8th
CCSS:
Also included in: 7th Grade Math - Probability and Statistics Bundle
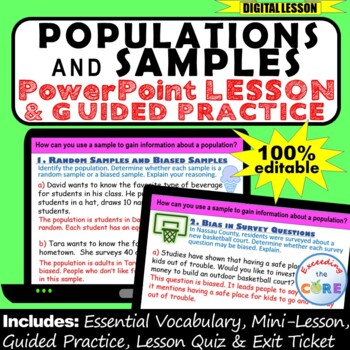
POPULATIONS AND SAMPLES PowerPoint Lesson & Guided Practice | Distance Learning
Great for online learning and distance learning!Get your students successfully solving problems involving POPULATIONS AND SAMPLES using this PowerPoint Presentation. This lesson begins with a focused mini-lesson and guided practice questions. It concludes with a lesson quiz and exit ticket to assess student understanding. All of the answers are included. This PowerPoint presentation is 100% editable, therefore you can modify any slide as needed.What is Included:✔️Mini-Lesson with Guided Practic
Subjects:
Grades:
6th - 8th
CCSS:
Also included in: STATISTICS: 7th Grade PowerPoint Lessons DIGITAL BUNDLE
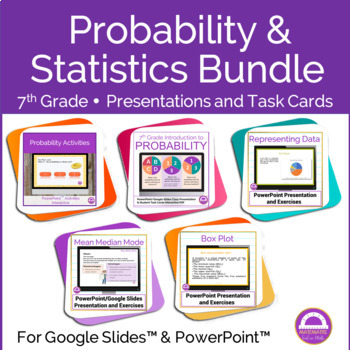
Bundle Statistics and Probability | 50% Discount
PowerPoint presentations on statistics and probalility. Perfect for an online lesson or distance learning.You can send it to your students and they'll have everything they need. If you are online with them, you can project it and comment.Or you can simply print it and give to your students.Suitable for IB MYP Middle Years ProgrammeIt includes:Mean, Mode and Median.With examples and exercises, for students to practice.This product and:Distance Learning - Mean. Mode, Median - Google Slideshttps:/
Subjects:
Grades:
6th - 9th
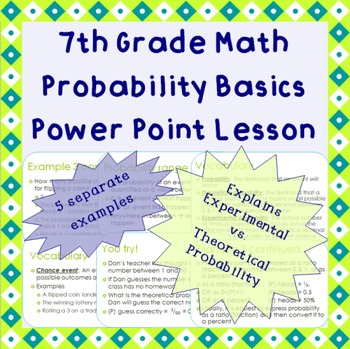
Probability Basics: A Power Point Lesson
This 19-slide Power Point is a great way to introduce basic probability concepts and terminology.
Why should you purchase this lesson?
• no prep
• engages the visual learner
• improves note-taking skills
• may improve student focus
• may improve student motivation
Goes through chance events, probability (theoretical and experimental), reporting probability as (P)event=x, and has numerous examples, guided practice, and independent practice.
Students MUST be comfortable converting fractions t
Subjects:
Grades:
6th - 8th
CCSS:
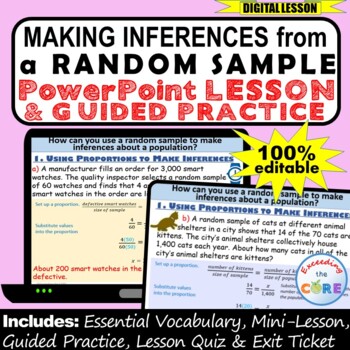
MAKING INFERENCES: RANDOM SAMPLE PowerPoint Lesson, Practice | Distance Learning
Great for online learning and distance learning!Get your students successfully solving problems involving MAKING INFERENCES FROM A RANDOM SAMPLE using this PowerPoint Presentation. This lesson begins with a focused mini-lesson and guided practice questions. It concludes with a lesson quiz and exit ticket to assess student understanding. All of the answers are included. This PowerPoint presentation is 100% editable, therefore you can modify any slide as needed.What is Included:✔️Mini-Lesson with
Subjects:
Grades:
6th - 8th
Also included in: STATISTICS: 7th Grade PowerPoint Lessons DIGITAL BUNDLE
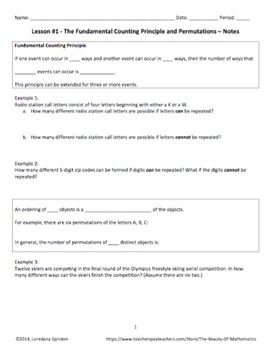
Counting Principle, Permutation, Combination Word Problems (Close Reading)
I've used these lessons for roughly twenty years with great success! Of course, I have made adjustments and improvements along the along the way and am passing the current version along to you. Math teachers can easily teach valuable close reading and problem solving skills to improve math literacy with these materials.
Solving word problems involving counting principle, permutation, and combination can be difficult for students because of the close reading that is necessary. Analyzing the
Subjects:
Grades:
8th - 11th, Higher Education
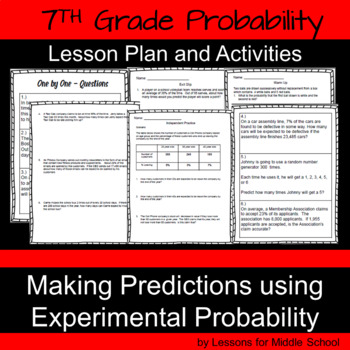
7th Grade Math - Probability -Making Predictions Using Experimental Probability
This lesson teaches students how to Make Predictions Using Experimental Probability. Students will be presented with data sets from experimental probability and then they must make predictions using experimental probability. Students will learn specific methods on how to use Proportional Reasoning or set up Linear Equations to solve these types of problems. Example Problem:If Jackson gets on base an average of 23% of the time she is at bat, how many times will she reach base if she has 155
Subjects:
Grades:
6th - 8th
CCSS:
Also included in: 7th Grade Math - Probability and Statistics Bundle

WHO'S YOUR DADDY? Corn Genetics Unit WITH Guided Inquiry Lab
50 PAGE Mendelian Genetics Unit with a Guided Inquiry Lab using an optional Chi-Squared Statistical Test.
This can be done as a lab or can just be used as a PowerPoint presentation on Genetics and/or Meiosis.
THIS LAB IS BEST USING THE REAL EARS OF CORN BUT CAN BE DONE WITH THE PHOTOS AT THE END. CORN EARS CAN BE OBTAINED FROM BIOLOGICAL SUPPLY COMPANIES OR YOUR GARDEN. :)
This lab covers the following concepts:
1. Corn Genetics, Monohybrids and Dihybrids
2. Corn (Plant) Reproduction (Ani
Subjects:
Grades:
7th - 12th, Higher Education, Adult Education
Probability and Statistics Units Bundle
This bundle includes both of my Probability Unit and my Statistics Unit (taught in Algebra 1, Algebra 2, or Statistics), also sold separately below:https://www.teacherspayteachers.com/Product/Statistics-Unit-2006021https://www.teacherspayteachers.com/Product/Probability-Unit-2006028Please check the links above for details about each unit. Buy the two units together and save!
Subjects:
Grades:
8th - 12th
Showing 1-24 of 162 results


