30 results
4th grade statistics lessons for Microsoft PowerPoint
Statistics Mean, Median, Mode & Range Interactive PowerPoint by Erica
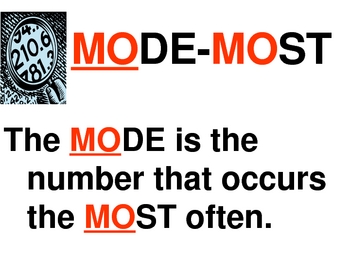
Introduce statistics including mean, median, mode and range with this colorful, interactive 22 slide PowerPoint. This interactive PowerPoint introduces each term and teaches a strategy for finding the value. There is also a trick or visual to help students remember the steps to find each one (mean, median, mode and range). Students are able to practice finding the mean, median, mode and range and then check within the PowerPoint. This is excellent for a statistics lesson or for students to e
Subjects:
Grades:
3rd - 6th
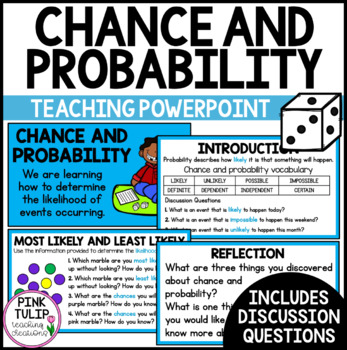
Chance and Probability - Teaching PowerPoint Presentation
Chance and Probability - Teaching PowerPoint PresentationCurriculum aligned PowerPoint presentation to guide explicit teaching of chance and probability, including likelihood. Includes:Learning intention.Introduction (tune in). Engaging graphics.Detailed explanations of various chance events.An in-depth vocabulary of terms such as likelihood, probability, chance, independent, dependent, and impossible.Discussion questions with answers.Reflection slides.Glossary. US spelling and UK spelling vers
Subjects:
Grades:
3rd - 5th
Also included in: Math PowerPoint Presentations Bundle
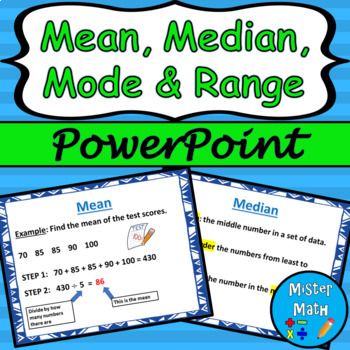
Mean, Median, Mode & Range PowerPoint Lesson
This is a PowerPoint Lesson to assist students in learning about finding the mean, median, mode, and range of data sets. The PowerPoint includes key vocabulary, as well as an example for each skill. Plenty of real-life examples are included to give students ample opportunities to connect the skills to the real world. The presentation also comes fully animated, with animations triggered by mouse click (or presentation pointer!)This PowerPoint lesson is also part of a BUNDLE that includes a guided
Subjects:
Grades:
3rd - 6th
Also included in: Mean, Median, Mode & Range PPT and Guided Notes BUNDLE
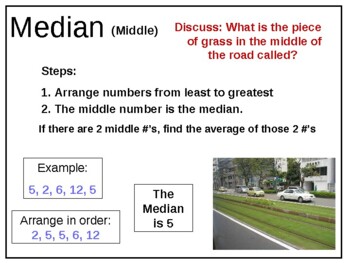
4th 5th 6th Grade Math Mean Median Mode Range MMMR Data Gr 4 5 6 Whole Numbers
This 16-slide Math PowerPoint introduces Mean, Median, Mode and Range and gives hints on how to remember each term. There are numerous practice problems as well. The numbers (data) used may be smaller than you desire, but the numbers are easily changeable and you'll still be able to use the examples. The last slide gives directions for a game to practice Mean, Median, Mode and Range using playing cards.
Subjects:
Grades:
4th - 6th
CCSS:
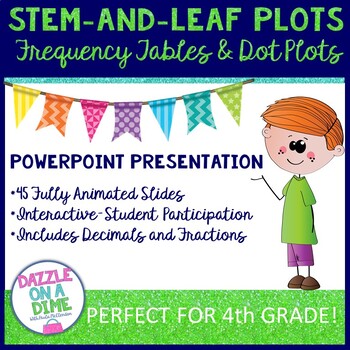
Stem and Leaf
Stem and Leaf Plots: This Stem and Leaf Presentation also includes Frequency Tables and Dot Plots appropriate for 4th grade TEKS Math standards. Stem and Leaf Plots are often very difficult for students to understand. This Stem and Leaf PowerPoint carefully constructs the key concepts for students to understand and develop new understandings. It also shows a visual comparison of Stem-and-Leaf Plots to Frequency Tables and Dot Plots. It contains examples of data using fractions and decimals t
Subjects:
Grades:
4th
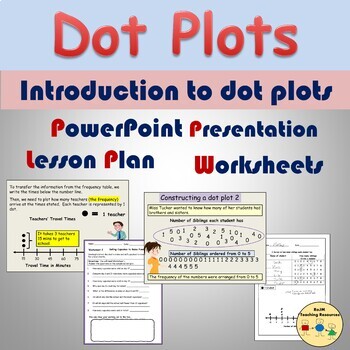
Dot Plots Line Plots Worksheets Presentation Frequency Tables Statistics
This resource relates to statistics on the topic of dot plots. It introduces dot plots on PowerPoint (12 Slides). The presentation demonstrates how the data was collected, rearranging data in numerical order, and presenting the data on a frequency table. Using the information on the frequency table, students are shown how to create a dot plot/line plot via Slide Show animation. Two detailed examples are shown. Content:· PowerPoint Presentation (12 Slides)· 1 Flexible Lesson Plan (1- 2 hrs)· 2 Se
Subjects:
Grades:
3rd - 5th
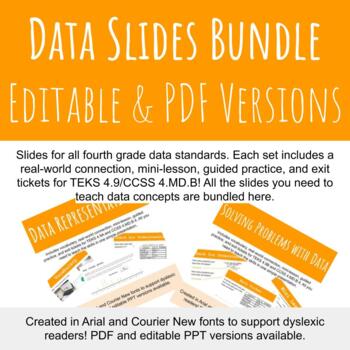
Data Slides Bundle
This is a bundle of two slideshows to introduce data concepts to your students (TEKS 4.9/CCSS 4.MD.B). Two skills are included:-Data representations (4.9A and B/4.MD.B.4)-Solving multi-step problems using data (4.9B/4.MD.B.4)This is a great deal for all of TEKS in unit 7/CCSS units on data. PowerPoints and PDFs are also available individually if you'd prefer to purchase each standard separately. This bundle helps you save as it includes both the editable PPT and non-editable PDF versions of all
Subjects:
Grades:
3rd - 5th
CCSS:
Unit 5 – Questions can be asked and answered by collecting and intepreting data
Accompanying slides for the Stage 2 NSW Mathematics unit- Unit 5 – Questions can be asked and answered by collecting and interpreting data.Contains 124 slides with lesson steps and teacher notes.
Subjects:
Grades:
3rd - 4th
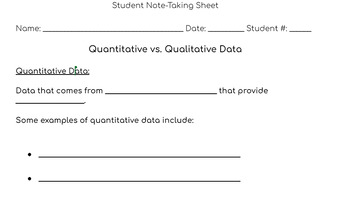
Quantitative vs. Qualitative Data - 5th Grade Science Lesson Plan & Resources
This lesson is great for introducing students to the concept of qualitative vs. quantitative data. I loved using this lesson prior to beginning my unit on matter and its interactions in my fifth grade science class (NGSS 5PS-1). There are also numerous ways you could use this lesson in a math classroom as well. This lesson plan contains links to google files for the following...- Google Slide Deck for teachers to display as they teach this lesson- Student Note-Taking Sheet (to record vocabulary)
Subjects:
Grades:
4th - 6th
NGSS:
5-PS1-3
, 5-PS1-2
, 5-PS1-1
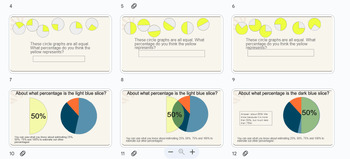
Estimating Percentages 2: Circle Graphs POWERPOINT
This mathematics PowerPoint resource is intended to support learners working on Virginia Standard of Learning:6.NS.1 a)Estimate and determine the percent represented by a given model (e.g., number line, picture, verbal description), including percents greater than 100% and less than 1%. This material was development for 1:1 review and tutoring. Teachers may find it useful for younger learners and students receiving special/exceptional education as well as with students learning in states other t
Subjects:
Grades:
4th - 6th
Estimating Percentages: 25%, 50%, 75%, 100% POWERPOINT
This mathematics Slide Deck resource is intended to support learners working on Virginia Standard of Learning:6.NS.1 a)Estimate and determine the percent represented by a given model (e.g., number line, picture, verbal description), including percents greater than 100% and less than 1%. This material was development for 1:1 review and tutoring. Teachers may find it useful for younger learners and students receiving special/exceptional education as well as with students learning in states other t
Subjects:
Grades:
4th - 6th

Probability: Deal or No Deal Power Point
Deal or No Deal. What a fun game show! This favorite game still lives on in video arcades around our country. Students love to play. It is a perfect way to explore the concepts of probability. 20 slides contain 15 different probability questions. Probability definition included. Pick a case! What is the probability it will contain one million dollars? You be the host and play as long as you want. My students love it.
Subjects:
Grades:
3rd - 8th
What's the Probability?
A wonderful lesson and class exercise over a probability to use with elementary age children. Reviews key terms to concept as well as practice example of each in a variety of ways. 4 thumbs up for this useful powerpoint presentation. A great minilesson or review tool as well. Students will be hooked all the way through. (Grades: 2-5)
Subjects:
Grades:
2nd - 5th
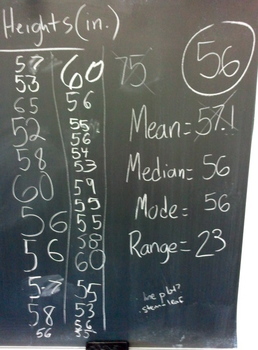
Introduction to Statistics (Focus on Mean, Median, Mode, & Range)
I use this PowerPoint presentation to introduce (or in some cases review) our statistics unit. It starts off with a warm-up where students measure each other to capture some class data on height. Then the slides go through key vocabulary words, like mean, median, mode, range, outlier, data set, and cluster. Each of those slides provides a definition that students can take notes from and an example. At the end of the presentation, students are encouraged to apply these statistical measures to
Subjects:
Grades:
3rd - 6th
CCSS:
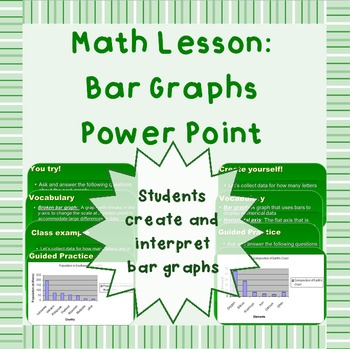
Bar graphs - Power Point presentation
This .ppt presentation is perfect for teachers who have students needing a refresher on bar graphs. It reviews the terminology of bar graphs (including broken bar graphs) and has students collect data in class and create a bar graph.
This is NOT a unit, assessment, or homework assignment.
This is in PPT Show format.
Other statistics PowerPoint lessons you may find useful:
Finding Mean Median Mode and Range Power Point Lesson
Basic standard deviation and distribution curves and statisti
Subjects:
Grades:
3rd - 7th
CCSS:
Intro to Probability, Mean, Median, Mode, and Range
In an effort to make high quality educational material more accessible to parents and teachers alike, regardless of location and/or socioeconomic status, I have decided to post lessons I create on here for FREE. The products I make consist mostly of Google Slides in PDF format for K-8th grade students. They cover a wide range of subject matter, but focus mainly on math and language development. Each lesson is created with the intention of keeping students attentive and actively engaged by using
Subjects:
Grades:
2nd - 4th
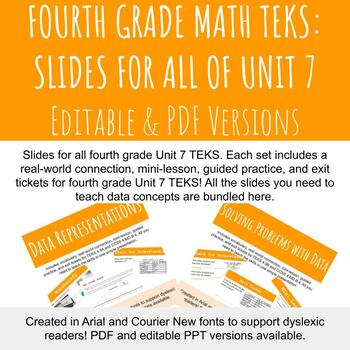
Fourth Grade Math TEKS: Slides for All of Unit 7
This is a bundle of two slideshows to introduce the fourth grade TEKS Unit 7 data concepts to your students (TEKS 4.9/CCSS 4.MD.B). Both skills in Unit 7 are included:-Data representations (4.9A and B/4.MD.B.4)-Solving multi-step problems using data (4.9B/4.MD.B.4)This is a great deal for all of TEKS in unit 7/CCSS units on data. PowerPoints and PDFs are also available individually if you'd prefer to purchase each standard separately. This bundle helps you save as it includes both the editable P
Subjects:
Grades:
3rd - 5th

Mean, Median, Mode, and Range - Lesson Plan
This is a full lesson plan to teach mean, median, mode, and range, complete with direct instruction, guided practice, and independent practice. (An evidence-based teaching strategy!) This lesson plan includes a PP, student worksheets, and a teacher's guide.This lesson plan uses universal design so students with a variety of reading and writing levels can access the materials. It presents materials in a variety of manners (visually, orally, kinesthetically) for all types of learners.This lesson p
Subjects:
Grades:
4th - 6th
CCSS:
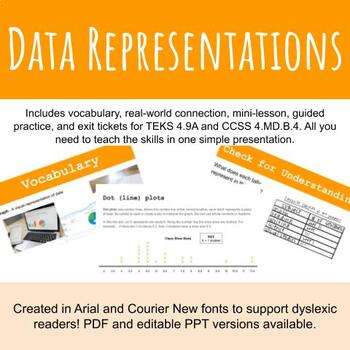
Data Representations PowerPoint Slides (PDF Form)
These slides introduce your students to TEKS 4.9A & D/CCSS 4.MD.B.4, data representations. Slides include the learning goal/success criteria, real-world connections, vocabulary, a mini lesson with checks for understanding and guided practice, and end with printable exit tickets (open-ended format and multiple choice). The slides introduce basic concepts and then add rigor to the questions to get your students thinking on a higher level.Use these slides whole group, small group, or as a tool
Subjects:
Grades:
4th - 5th
CCSS:
Also included in: Data Slides Bundle
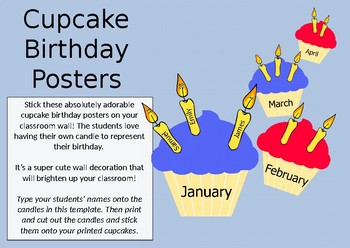
Superhero Colored Birthday Posters!
Includes:
-12x superhero colored cupcake posters printable on a4 paper (1 for each month of the year)
-Editable candle template that you can type your students' names and date of birth onto.
- Blank candles that the students can color themselves
Great for a math data lesson!
Stick these absolutely adorable superhero colored birthday posters on your classroom wall to go with your superhero theme!
Subjects:
Grades:
PreK - 4th
Types:
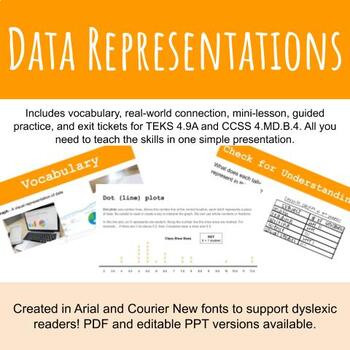
Data Representations PowerPoint Slides (Editable PPT Form)
These slides introduce your students to TEKS 4.9A and D/CCSS 4.MD.B.4, data representations. Slides include the learning goal/success criteria, real-world connections, vocabulary, a mini lesson with checks for understanding and guided practice, and end with printable exit tickets (open-ended format and multiple choice). The slides introduce basic concepts and then add rigor to the questions to get your students thinking on a higher level.Use these slides whole group, small group, or as a tool fo
Subjects:
Grades:
4th - 5th
CCSS:
Also included in: Data Slides Bundle

Probability Lesson on Likelihood
This lesson is a great lesson to use after you have introduced likelihood to review and practice or to informally assess students. This lesson includes 2 review/re-teach slides and 4 slides of student interactive practice. The questions pop-up one at a time and the answers appear after clicking. My students love this lesson and were disappointed there were not more slides! They were engaged and enjoyed being part of the lesson (and being able to shout out answers!)
Please see preview file f
Subjects:
Grades:
3rd - 8th
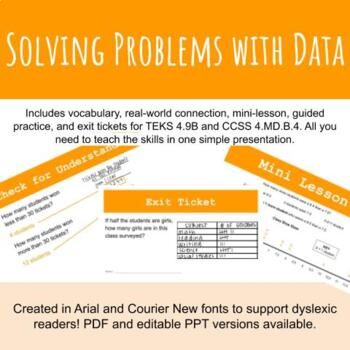
Solving Problems with Data PowerPoint Slides (Editable PPT Form)
These slides introduce your students to TEKS 4.9B and D/CCSS 4.MD.B.4, solving multi-step problems using data. Slides include the learning goal/success criteria, real-world connections, vocabulary, a mini lesson with checks for understanding and guided practice, and end with printable exit tickets (open-ended format and multiple choice). The slides introduce basic concepts and then add rigor to the questions to get your students thinking on a higher level.Use these slides whole group, small grou
Subjects:
Grades:
4th
CCSS:
Also included in: Data Slides Bundle

Mean,Median, Mode and Range = Fun
This lesson provides how to find the mean, median, mode and range. Each section provides a few examples, and even has one class activity that can be used for each section of the lesson. At the end, there is a quick review to assess the students on if they understood the material.
Subjects:
Grades:
3rd - 5th
Showing 1-24 of 30 results


