51 results
Adult education statistics lessons for Microsoft PowerPoint
6th Grade Statistics & Data 5 - Box and Whisker Plot Powerpoint Lesson
Sixth Grade Statistics 5 - Box and Whisker Plot Powerpoint Lesson is powerful when used as direct instruction in the classroom, online or individually. It teaches students all the skills necessary to make a box and whisker plot: mean, median, lower quartile Q1, upper quartile Q3, inter quartile range, range, minimum and maximum numbers. Students then are shown how to take this information and build a box and whisker plot. Finally, students are taught how to analyze the box and whisker plot th
Subjects:
Grades:
6th, Adult Education
Also included in: 6th Grade Statistics & Data Bundle - 6 Powerpoint Lessons - 402 Slides
6th Grade Statistics & Data 1 - Statistical Questions & Types of Data Lesson
Sixth Grade Statistics 1 - Statistical Questions and Types of Data Powerpoint Lesson is powerful when used as direct instruction in the classroom, online, or individually. It teaches students how to recognize and pose a statistical question. Students also learn the difference between numerical and categorical data. They also learn the 4 basic steps in presenting data: posing a statistical question, gathering the data, displaying the data, and answering the question they posed. There are 22
Subjects:
Grades:
6th, Adult Education
CCSS:
Also included in: 6th Grade Statistics & Data Bundle - 6 Powerpoint Lessons - 402 Slides
IB Psychology Internal Assessment (IA) Analysis and Statistics Slides
Walk your students through the Analysis section of the Internal Assessment (IA). Google slides include content and background information on statistics, directions and links for students to follow while they write their Analysis section, create their table and graph, and run descriptive statistics and inferential statistics with their raw data. Includes links to online calculators for mean, standard deviation, Mann Whitney U Test, Wilcoxon Test. Analysis rubric and links to two IA exemplars incl
Subjects:
Grades:
9th - 11th, Higher Education, Adult Education

6th Grade Powerpoint Mega Math Bundle - 58 Lessons - 2923 Slides
Sixth Grade Powerpoint Math Bundle is composed of 58 different high quality math powerpoint lessons comprising 2,923 slides. These are perfect for distance learning on Zoom or similar formats. On top of that they are powerful when used as direct instruction in the classroom.There are 22 strategies of effective teaching based on research in these powerpoint lessons. . For further information on each lesson click on them individually. This is a growing bundle which means as new products are a
Subjects:
Grades:
6th, Adult Education
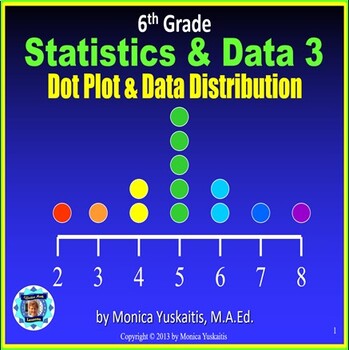
6th Grade Statistics & Data 3 - Dot Plot and Data Distribution Powerpoint Lesson
Sixth Grade Statistics 3 - Dot Plot and Data Distributions Powerpoint Lesson - is powerful when used as direct instruction in the classroom, online, or individually. It teaches students how to read and create dot plots. In addition, students learn to analyze the data as to its center, spread, and most common numbers. There are 22 strategies of effective teaching based on research. For best results, students should have white boards and dry erase markers. For instructions on how to successf
Subjects:
Grades:
6th, Adult Education
CCSS:
Also included in: 6th Grade Statistics & Data Bundle - 6 Powerpoint Lessons - 402 Slides
6th Grade Statistics & Data 6 - Mean Absolute Deviation Powerpoint Lesson
Sixth Grade Statistics 6 - Mean Absolute Deviation Powerpoint Lesson is powerful when used as direct instruction in the classroom, online or individually. It teaches students the steps to take to find the Mean Absolute Deviation of a set of data. The skills necessary to do this task are reviewed: how to find the mean, how to find absolute values of numbers, and how to add and subtract integers. There are 22 effective teaching strategies based on research used in this lesson. For best resul
Subjects:
Grades:
6th, Adult Education
Also included in: 6th Grade Statistics & Data Bundle - 6 Powerpoint Lessons - 402 Slides

Statistics Module Bundle
Dear Customers!This Statistics Module Bundle file contains 18 lectures which are covered during Statistics Module.Each lecture containing:- Lecture PPT- Test Bank with answers for each lecture - Exercises for seminars/lectures with answers
Subjects:
Grades:
6th - 12th, Higher Education, Adult Education, Staff
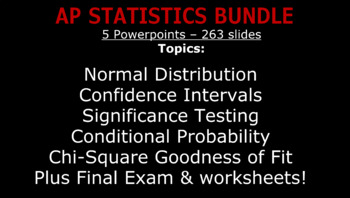
AP Statistics Bundle: Lecture/Worksheets - Hypothesis Testing, Confidence & More
This bundle includes the following presentation/lectures:- 22-slide presentation on Independence and Conditional Probability- 41-slide presentation on the Normal Distribution & Z-Scores- 55-slide presentation on the Student's T-Distribution- 96-slide presentation on Confidence Intervals & Hypothesis Testing- 49-slide presentation on Chi-Square Goodness of Fit TestingA Cumulative Final Exam with 36 questionsWorksheets on probability, sampling and box & whisker charts, measures of cent
Subjects:
Grades:
10th - 12th, Higher Education, Adult Education
6th Grade Statistics & Data 2 - Mean, Median, Mode & Range Powerpoint Lesson
Sixth Grade Statistics 2 - Mean, Median, Mode and Range Powerpoint Lesson is powerful when used as direct instruction in the classroom, online, or individually. It teaches students how to find the mean, median, mode and range in a group of statistics. There are 22 effective teaching strategies based on research used in this lesson. For best results, students should have white boards and dry erase markers. For instructions on how to successfully use this powerpoint math lesson click here.
Subjects:
Grades:
6th, Adult Education
Also included in: 6th Grade Statistics & Data Bundle - 6 Powerpoint Lessons - 402 Slides

WHO'S YOUR DADDY? Corn Genetics Unit WITH Guided Inquiry Lab
50 PAGE Mendelian Genetics Unit with a Guided Inquiry Lab using an optional Chi-Squared Statistical Test.
This can be done as a lab or can just be used as a PowerPoint presentation on Genetics and/or Meiosis.
THIS LAB IS BEST USING THE REAL EARS OF CORN BUT CAN BE DONE WITH THE PHOTOS AT THE END. CORN EARS CAN BE OBTAINED FROM BIOLOGICAL SUPPLY COMPANIES OR YOUR GARDEN. :)
This lab covers the following concepts:
1. Corn Genetics, Monohybrids and Dihybrids
2. Corn (Plant) Reproduction (Ani
Subjects:
Grades:
7th - 12th, Higher Education, Adult Education
6th Grade Statistics & Data 4 - Histogram Powerpoint Lesson
Sixth Grade Statistics 4 - Histogram Powerpoint Lesson is powerful when used as direct instruction in the classroom, online or individually. It teaches students how to identify a histogram and how to make one. Comparisons are made between a bar graph and a histogram. Many terms are defined such as axis, scale, frequency, count, range, interval, mound, skewed left, skewed right and more. There are 22 effective teaching strategies based on research used in this lesson. For best results, stud
Subjects:
Grades:
6th, Adult Education
Types:
Also included in: 6th Grade Statistics & Data Bundle - 6 Powerpoint Lessons - 402 Slides
AP Statistics Lessons
This set of PowerPoint presentations includes all the lessons and homework assignments I developed to teach AP Statistics. Each lesson includes lesson goals, lecture materials, bolded key definitions, activities (including links to actual, relevant AP problems by section), and homework assignments.
You could use these lessons to teach in its entirety a year-long AP Statistics course, or a college-level Statistics 101 or even a HS-level non-AP statistics course with minor tweaking. I generally d
Subjects:
Grades:
9th - 12th, Higher Education, Adult Education
CCSS:

Chapter 6 Normal Probability Distribution Bundle
This zip folder contains 2 click animated PowerPoint Presentations and two Word files that contain fillable notes to go with those presentations. All the files are editable. They cover the material for sections 6-1 through 6-4 of Bluman's Elementary Statistics textbook. The objectives are:
- To identify properties of a normal distribution
- Find the area under the standard normal distribution, given various z values
- Find probabilities for normally distributed variables by converting them
Subjects:
Grades:
10th - 12th, Higher Education, Adult Education

Key Performance Data Dashboards Bundle
Bundle includes presentation slides, printable graphic organizer for written practice, virtual graphic organizer for online practice, final project template and rubric.Student assignments are in three parts:Part 1: Print out KPI graphic organizer on 11x17 for students to draw sample charts showcased on presentation slides.Part 2: Virtual graphic organizer practice on Canva.Part 3: Final KPI Dashboard project Canva template.
Subjects:
Grades:
8th - 12th, Higher Education, Adult Education
Tree Diagrams - Fully planned lesson
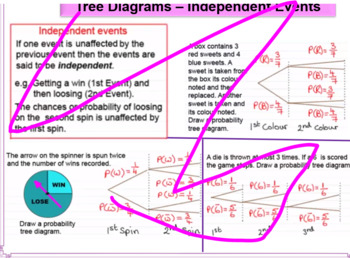
Fully planned lesson introducing Tree Diagrams to students including how to work out the different probabilities.Has simple Tree Diagrams as well as advanced Higher education examples and questions. Explanations of Dependent, Independent and Exclusive events. Also includes conditional probability.
Subjects:
Grades:
8th - 12th, Higher Education, Adult Education
Cumulative Frequency Graphs - Statistics PowerPoint
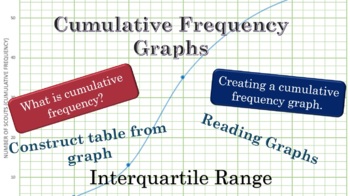
This PowerPoint lesson introduces the ins and outs of cumulative frequency graphs to students. (To see a video made from this lesson, please watch this video: https://youtu.be/GPZrMR9DHXs). Students should know how and why to use cumulative frequency graphs, how to create one from a table of data, how to gain insight into the data from using a cumulative frequency graph, create a data table from a cumulative frequency graph, as well as answer questions about various percentiles, as well as fi
Subjects:
Grades:
10th - 12th, Adult Education
Types:

Research Methods Module - Analyzing Qualitative Data
Research Methods Module - Analyzing Qualitative Data Lecture is covered by students who are writing final research projects.
Here is Outline of lecture:
What qualitative data gives us
General principles of analysis
Practical pointers
In this File you will find:
- 1 Research Methods - Analyzing Qualitative Data Lecture Power Point Presentation
- 2 Seminar Plan with different Exercises and case studies for practice
!!! Attention !!! for Seminars you are required to have access to NVivo Sof
Subjects:
Grades:
Higher Education, Adult Education
Confidence Interval Estimation (Statistics)
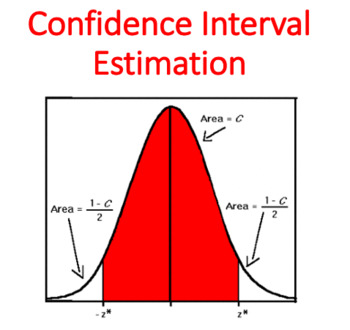
Confidence Interval Estimation is a lecture which is covered within the Statistic or Basic Business Statistic module by business and economics students. Suppose you want to estimate the mean GPA of all the students at your university. The mean GPA for all the students is an unknown population mean, denoted by u. You select a sample of students and compute the sample mean, denoted by X, to be 2.80. As a point estimate of the population mean, u, you ask how accurate is the 2.80 value as an estimat
Subjects:
Grades:
5th - 12th, Higher Education, Adult Education, Staff
Also included in: Statistics Module Bundle
AP Statistics Chapter 8 - Sampling Variability and Sampling Distributions
This is a PowerPoint presentation to accompany the 8th chapter of Peck, Olsen, and Devore's "Introduction to Statistics and Data Analysis" 4th Edition. The chapter and PowerPoint focus on sampling distributions and sample variability.
Subjects:
Grades:
9th - 12th, Higher Education, Adult Education

Permutations and Combinations PowerPoint
A great PowerPoint to introduce the combinatorics of factorials, permutations and combinations, as well as the probability concepts of the addition and multiplication principles. It also covers Pascal's Triangle and its link to combinations.The PowerPoint contains references to the Maths Quest Textbook, but these can be edited to suit your textbook, or deleted.
Subjects:
Grades:
9th - 12th, Higher Education, Adult Education
CCSS:
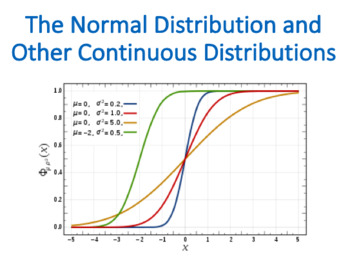
The Normal Distribution and Other Continuous (Statistics)
The Normal Distribution and Other Continuous is a lecture which is covered within the Statistic or Basic Business Statistic module by business and economics students. This lecture will help you learn about characteristics of continuous probability distributions and how to use the normal distribution to solve business problems. In this lecture, you learn to: To compute probabilities from the normal distributionHow to use the normal distribution to solve business problemsTo use the normal probabil
Subjects:
Grades:
5th - 12th, Higher Education, Adult Education, Staff
Also included in: Statistics Module Bundle

Discrete Probability Distributions (Statistics)
Discrete Probability Distributions is a lecture which is covered within the Statistic or Basic Business Statistic module by business and economics students. This lecture introduces you to the concept and characteristics of probability distributions. Moreover, you will learn how the binomial, Poisson, and hypergeometric distributions can be applied to help solve business problems. A probability distribution for a discrete variable is a mutually exclusive list of all the possible numerical outcome
Subjects:
Grades:
5th - 12th, Higher Education, Adult Education, Staff
Also included in: Statistics Module Bundle

Normal Probability Distributions Lecture (Elementary Statistics Module)
Normal Probability Distributions Lecture (Elementary Statistics Module)In this lecture we introduce continuous probability distributions, and most of this lecture focuses on normal distributions.Here are the lecture objectives:1. The Standard Normal Distribution• Describe the characteristics of a standard normal distribution.• Find the probability of some range of z values in a standard normal distribution.• Find z scores corresponding to regions under the curve representing a standard normal di
Subjects:
Grades:
8th - 12th, Higher Education, Adult Education, Staff
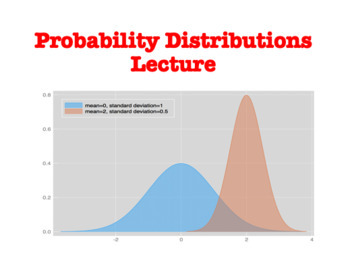
Probability Distributions Lecture (Elementary Statistics Module)
Probability Distributions Lecture (Elementary Statistics Module)This is a lecture which is covered during Elementary Statistics Module with students who just started to learn Statistics.The main objective of this chapter is to cover Probability Distribution, Binominal Probability Distribution as well as Poisson Probability distribution. More details of the lecture agenda could be found bellow.Agenda of Introduction to Statistics Lecture is as following:1. Probability DistributionDefine random va
Subjects:
Grades:
8th - 12th, Higher Education, Adult Education, Staff
Showing 1-24 of 51 results


