83 results
5th grade statistics lessons for Microsoft PowerPoint
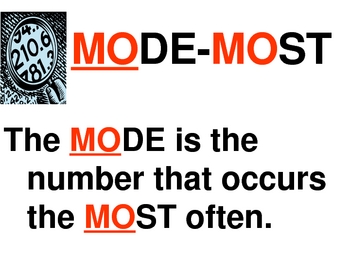
Statistics Mean, Median, Mode & Range Interactive PowerPoint by Erica
Introduce statistics including mean, median, mode and range with this colorful, interactive 22 slide PowerPoint. This interactive PowerPoint introduces each term and teaches a strategy for finding the value. There is also a trick or visual to help students remember the steps to find each one (mean, median, mode and range). Students are able to practice finding the mean, median, mode and range and then check within the PowerPoint. This is excellent for a statistics lesson or for students to e
Subjects:
Grades:
3rd - 6th

Box and Whisker Plot PPT and Guided Notes 6.SP.2 , 6.SP.4 , 6.SP.5
Box and Whisker Plot
This PPT lesson teaches students the vocabulary that goes with box and whisker plots as well as the steps for creating a box and whisker plot.
Along with the PPT are guided notes where students can answer questions while watching the PPT as well as the answer key. They also have the chance to create their own box and whisker plot. This is a great introductory lesson. This matches Common Core Standards for 6th grade, but could be adapted and used for other grades as we
Subjects:
Grades:
5th - 8th
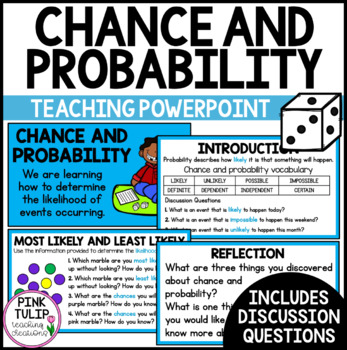
Chance and Probability - Teaching PowerPoint Presentation
Chance and Probability - Teaching PowerPoint PresentationCurriculum aligned PowerPoint presentation to guide explicit teaching of chance and probability, including likelihood. Includes:Learning intention.Introduction (tune in). Engaging graphics.Detailed explanations of various chance events.An in-depth vocabulary of terms such as likelihood, probability, chance, independent, dependent, and impossible.Discussion questions with answers.Reflection slides.Glossary. US spelling and UK spelling vers
Subjects:
Grades:
3rd - 5th
Also included in: Math PowerPoint Presentations Bundle
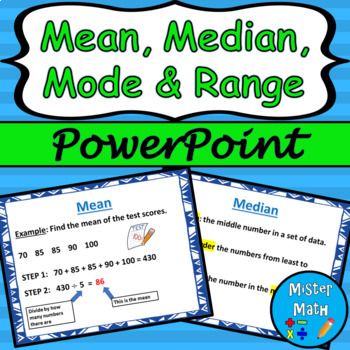
Mean, Median, Mode & Range PowerPoint Lesson
This is a PowerPoint Lesson to assist students in learning about finding the mean, median, mode, and range of data sets. The PowerPoint includes key vocabulary, as well as an example for each skill. Plenty of real-life examples are included to give students ample opportunities to connect the skills to the real world. The presentation also comes fully animated, with animations triggered by mouse click (or presentation pointer!)This PowerPoint lesson is also part of a BUNDLE that includes a guided
Subjects:
Grades:
3rd - 6th
Also included in: Mean, Median, Mode & Range PPT and Guided Notes BUNDLE
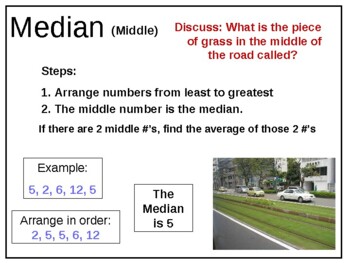
4th 5th 6th Grade Math Mean Median Mode Range MMMR Data Gr 4 5 6 Whole Numbers
This 16-slide Math PowerPoint introduces Mean, Median, Mode and Range and gives hints on how to remember each term. There are numerous practice problems as well. The numbers (data) used may be smaller than you desire, but the numbers are easily changeable and you'll still be able to use the examples. The last slide gives directions for a game to practice Mean, Median, Mode and Range using playing cards.
Subjects:
Grades:
4th - 6th
CCSS:
6th Grade Math -Probability and Statistics Bundle
6th Grade Math – Probability and Statistics Bundle - 9 LessonsThis COMPREHENSIVE bundle covers all of the 6th Grade Common Core Math Standards. This is a comprehensive unit so the teacher will only have to download the product and then print out copies with their students. This bundle is part of our 6th Grade Yearlong Math Curriculum. ABSOLUTELY NO PREP REQUIRED, just download and start teaching in minutes. Our preview product is an example of how each individual lesson in the unit is struct
Subjects:
Grades:
5th - 7th
6th Grade Math Probability & Statistics-Statistical vs Non-Statistical Questions
This lesson focuses on asking Statistical vs Non-Statistical Questions. This lesson provides instruction and learning opportunities where students evaluate whether statements can be tested using statistics. Math CCSS 6.SP.1 is the focus - Recognize a statistical question as one that anticipates variability in the data related to the question and accounts for it in the answers. For example, “How old am I?” is not a statistical question, but “How old are the students in my school?” is a statisti
Subjects:
Grades:
5th - 7th
CCSS:
Also included in: 6th Grade Math -Probability and Statistics Bundle
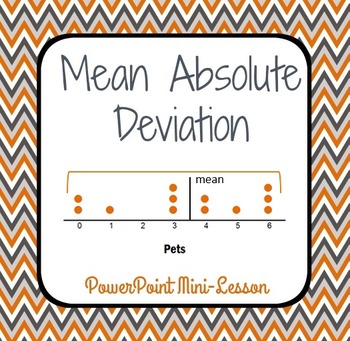
Mean Absolute Deviation - PowerPoint Mini Lesson Introduction
This PowerPoint mini-lesson introduces your students to the concept of the Mean Absolute Deviation (M.A.D.). It's presented in kid-friendly language, and it walks your students through the process, one step at a time. Most of the calculations use nice, whole numbers. The visual models will help your students understand the concept while they calculate this measure of variation.Check out the Preview file, so you understand what you're receiving on these 15 slides.Want a follow up activity here
Subjects:
Grades:
5th - 6th
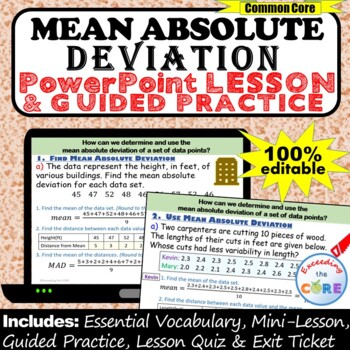
MEAN ABSOLUTE DEVIATION (MAD) PowerPoint Lesson & Practice | Distance Learning
Great for online learning and distance learning!Get your students successfully finding the MEAN ABSOLUTE DEVIATION (MAD) with this PowerPoint Presentation. This lesson begins with a focused mini-lesson and guided practice questions. It concludes with a lesson quiz and exit ticket to assess student understanding. All of the answers are included. This PowerPoint presentation is 100% editable, therefore you can modify any slide as needed.What is Included:_ Mini-Lesson with Guided PracticeThe mini-
Subjects:
Grades:
5th - 7th
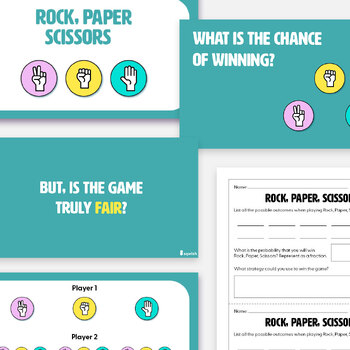
Year 5: Rock, Paper, Scissors (statistics & probability)
Is there a better way of teaching Probability and Chance to a bunch of Year 5 students than using the age-old Rock, Paper, Scissors game? While it's a common go-to for settling disputes, have we ever paused to consider its fairness?In this lesson, students delve into the probability of winning Rock, Paper, Scissors and express these probabilities as fractions. However, they will soon discover that this classic game isn’t as fair as they have been led to believe.WHAT'S INCLUDEDLesson Plan (1.5 A4
Subjects:
Grades:
5th
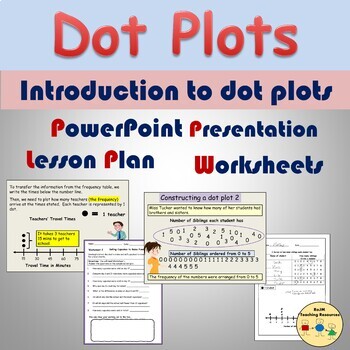
Dot Plots Line Plots Worksheets Presentation Frequency Tables Statistics
This resource relates to statistics on the topic of dot plots. It introduces dot plots on PowerPoint (12 Slides). The presentation demonstrates how the data was collected, rearranging data in numerical order, and presenting the data on a frequency table. Using the information on the frequency table, students are shown how to create a dot plot/line plot via Slide Show animation. Two detailed examples are shown. Content:· PowerPoint Presentation (12 Slides)· 1 Flexible Lesson Plan (1- 2 hrs)· 2 Se
Subjects:
Grades:
3rd - 5th
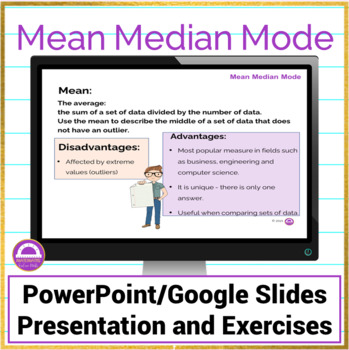
Mean Median Mode Notes and Activities
Make teaching Mean Median and Mode easy with this super engaging digital Teacher Presentation and printable Student notes! Perfect for both In Person and Distance Learning, this resource has everything you need to give your students a solid foundation with examples and class practice exercises during the presentation.This resource includes:Teacher Presentation in both Google Slides and PowerPoint that provides colorful visuals illustrating concepts along with examples;A pdf greyscale version of
Subjects:
Grades:
5th - 8th
Also included in: Bundle Statistics and Probability | 50% Discount
7th Grade Math -Probability and Statistics - Sample Spaces and Outcomes
This lesson focuses on determining Sample Spaces and Outcomes. ABSOLUTELY NO PREP REQUIRED, just download and start teaching in minutes. This unit is part of our 7th Grade Year Long Curriculum. This is part of our Probability Unit Bundle.*************************************************************************************************************INCLUDED WITH EACH LESSON➯Lesson Plan➯Power Point Presentation➯Warm Up Activity➯Guided Notes➯Cooperative Learning Structure➯Independent Practice➯Exit S
Grades:
5th - 7th
CCSS:
Also included in: 7th Grade Math - Probability and Statistics Bundle
6th Grade Math -Probability and Statistics - Dot Plots and Line Plots
This lesson focuses on Dot Plots and Line Plots. This COMPREHENSIVE requires ABSOLUTELY NO PREP, just download and start teaching in minutes.PRODUCT INCLUDES:➯Overview of Lesson and Teacher Instructions➯Lesson Plan➯Warm Up➯Guided Notes➯Power Point Presentation➯Cooperative Learning Activity➯Independent Practice Activity➯Exit Slip➯Answer Sheets*************************************************************************************************************LOOKING FOR MORE PROBABILITY & STATISTICS
Subjects:
Grades:
5th - 7th
CCSS:
Also included in: 6th Grade Math -Probability and Statistics Bundle
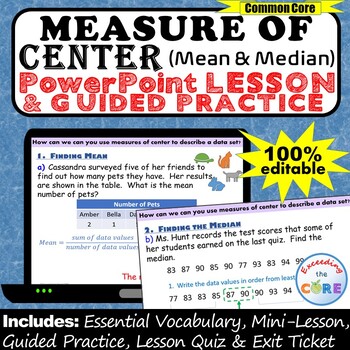
MEASURE OF CENTER (Mean, Median) PowerPoint Lesson & Practice |Distance Learning
Great for online learning and distance learning!Get your students successfully finding the MEASURE OF CENTER (Mean and Median) with this PowerPoint Presentation. This lesson begins with a focused mini-lesson and guided practice questions. It concludes with a lesson quiz and exit ticket to assess student understanding. All of the answers are included. This PowerPoint presentation is 100% editable, therefore you can modify any slide as needed.What is Included:_ Mini-Lesson with Guided PracticeThe
Subjects:
Grades:
5th - 7th
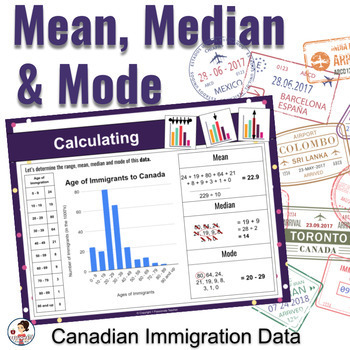
Mean Median and Mode Data Management Set: Grade 5 New Math Ontario Curriculum
How am I ever going to get all of this covered and when will I have time to plan it all? If you have ever found yourself asking this question, then this measures of central tendency meets Canadian Immigration (Social Studies) lesson and activity set is for you. Cover calculating, analyzing, and comparing, along with Canadian immigration trends using real-world data.This set is perfect for anyone who:is ready to be done with planningdoesn't have enough time to cover all of the expectations is lo
Subjects:
Grades:
5th - 6th
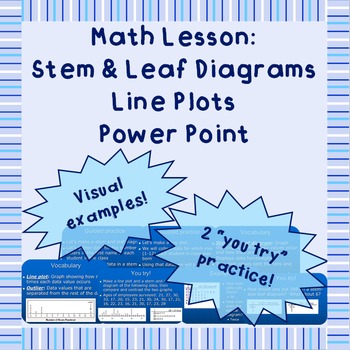
Stem & Leaf Diagrams and Line Plots - A Power Point Lesson
This short, 9-slide lesson is a great way to introduce, practice, or review making and reading stem and leaf diagrams and making line plots. Has examples, guided practice, and independent practice.
Includes 2 class activities to gather data and create 1 stem and leaf diagram and 1 line plot.
NOT CCSS-aligned
File is in .ppsx (2010 Power Point Show) format.
If you decide to purchase, please leave me a comment about this product. Thank you for your business and feedback!
Other statistics res
Subjects:
Grades:
5th - 7th
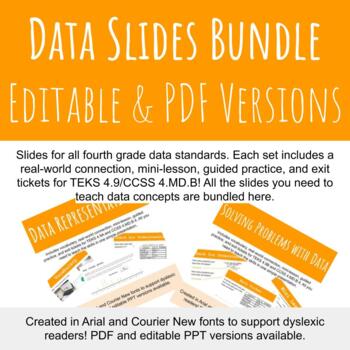
Data Slides Bundle
This is a bundle of two slideshows to introduce data concepts to your students (TEKS 4.9/CCSS 4.MD.B). Two skills are included:-Data representations (4.9A and B/4.MD.B.4)-Solving multi-step problems using data (4.9B/4.MD.B.4)This is a great deal for all of TEKS in unit 7/CCSS units on data. PowerPoints and PDFs are also available individually if you'd prefer to purchase each standard separately. This bundle helps you save as it includes both the editable PPT and non-editable PDF versions of all
Subjects:
Grades:
3rd - 5th
CCSS:
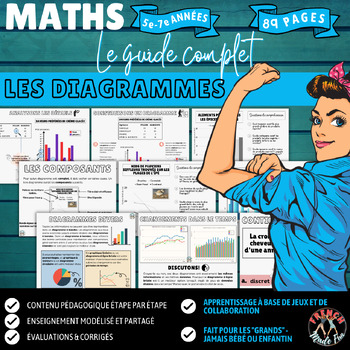
FRENCH MATHS | SANS CAHIER/PAPERLESS | DIAGRAMMES/CHARTS | REPRESENTATION
Having trouble visualizing how to "break down" math concepts and how to structure your teaching? New to this grade level or unfamiliar with "how" to teach it? Tired of passing out worksheets? If you're wanting to try something else to see if your students become more engaged and confident in math... Look no further. No book? No problem. Printer broken? No problem. Multi-levelled or split classrooms? No problem.Imagine math classes that require zero prep, zero paper, zero planning, and slides whi
Subjects:
Grades:
5th - 7th
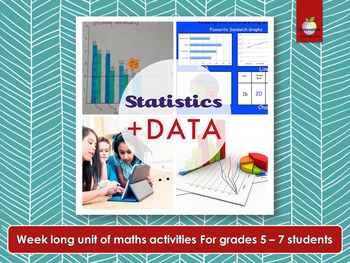
Statistics & Data Math Unit | Project Based Learning | Mean, Median, Mode, Range
Make math relevant and engaging for your students with the elementary/primary STATISTICS and DATA PROJECT. This NO PREP, this hands-on PROJECT-BASED LEARNING, will keep your class busy learning about MEAN, MEDIAN, MODE and RANGE for a whole week.COVERINGHow to ask and survey an “essential question.”Data collection methodsDrawing mathematical conclusions from dataPresenting data in graphs and tablesPresenting data and conclusions to peersThis insightful project makes a great, lively introduction
Subjects:
Grades:
5th - 7th
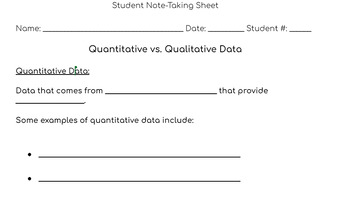
Quantitative vs. Qualitative Data - 5th Grade Science Lesson Plan & Resources
This lesson is great for introducing students to the concept of qualitative vs. quantitative data. I loved using this lesson prior to beginning my unit on matter and its interactions in my fifth grade science class (NGSS 5PS-1). There are also numerous ways you could use this lesson in a math classroom as well. This lesson plan contains links to google files for the following...- Google Slide Deck for teachers to display as they teach this lesson- Student Note-Taking Sheet (to record vocabulary)
Subjects:
Grades:
4th - 6th
NGSS:
5-PS1-3
, 5-PS1-2
, 5-PS1-1
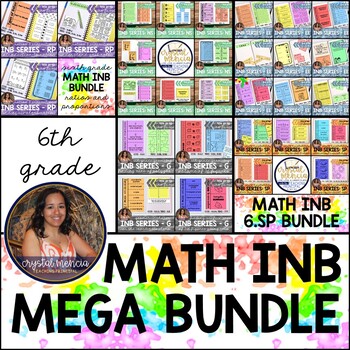
6th Grade Math INB MEGA BUNDLE (Interactive Notebook Series)
Looking for sixth grade math interactive notebook resources for the WHOLE YEAR? This mega bundle is for you! All activities included are LOW PREP and come with answer keys! Each blackline master included in this resource reduces paper use by providing materials for at least two (2) students and are perfectly sized for composition notebook use. Pricing will increase as the bundle is completed.WHAT'S INCLUDED:→ terms of use/how to use this product→ real-life photos of completed pages in a student
Subjects:
Grades:
5th - 7th
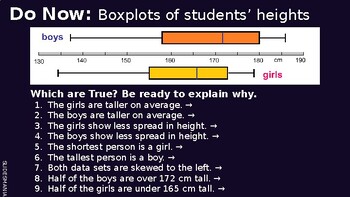
Displaying Data on Frequency Tables & Histograms Lesson Notes
This is a PowerPoint that can be used as notes for understating data on frequency tables and histograms. These notes are structured with a do now, and objective, followed by scaffolded examples and practice questions. These notes align with the EnVisions Math textbook for topic 8, lesson 4 but can be used separately as well!
Subjects:
Grades:
5th - 8th
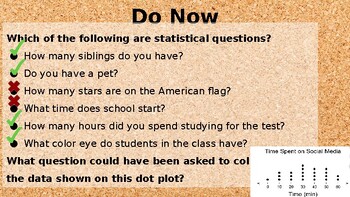
Calculating Mean, Median, Mode, and Range of a Data Set
This is a power point that can be used as notes when learning to calculate mean, median, mode, and range of a data set. These notes are structured with a do now, and objective, followed by scaffolded examples and practice questions. These notes align with the EnVisions Math textbook for topic 8, lesson 2 but can be used separately as well!
Subjects:
Grades:
5th - 8th
Showing 1-24 of 83 results


