123 results
Free statistics lessons for Microsoft PowerPoint
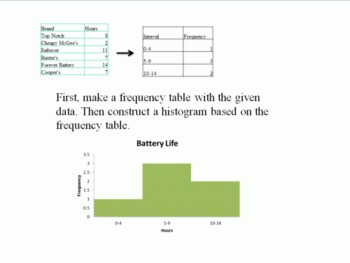
Graphs and Statistics
These five lessons cover the basics about describing sets of data. Topics covered are mean, median, mode and range. There is also information about bar graphs, histograms, line graphs, and circle graphs, as well as line plots and frequency tables. There is also a lesson about misleading graphs and statistics, providing a great opportunity to teach CCSS.Math.Practice.MP3 (Construct viable arguments and critique the reasoning of others.)
This work is licensed under a Creative Commons Attribution-
Subjects:
Grades:
5th - 7th
Intro to Probability, Mean, Median, Mode, and Range
In an effort to make high quality educational material more accessible to parents and teachers alike, regardless of location and/or socioeconomic status, I have decided to post lessons I create on here for FREE. The products I make consist mostly of Google Slides in PDF format for K-8th grade students. They cover a wide range of subject matter, but focus mainly on math and language development. Each lesson is created with the intention of keeping students attentive and actively engaged by using
Subjects:
Grades:
2nd - 4th

Measures of Central Tendency PowerPoint
Here lies a PowerPoint for a quick review of how to choose the most beneficial measure of central tendency and how to calculate a "wanted" or "missing" piece of data when using mean. This makes a good math center, bellwork, or whole class discussion. Sometimes I use it to pre-test; sometimes for a post-test. ENJOY!
Subjects:
Grades:
7th - 9th
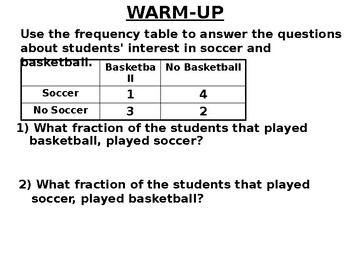
Math 8 19.6 Find the Relative Frequencies of the Data
This editable lesson was written by Alex Benn using the concepts described in his book Tenacious-Teaching: Uniting Our Superpowers to Save Our Classrooms and his website: Tenacious-Teaching.com. It includes an introductory warm-up designed to remediate the required prerequisite knowledge; concise notes; tasks that require escalating effort; numerous examples to prevent misconceptions; and in-class practice problems to promote mastery. It does not include answers to the tasks provided. Those are
Subjects:
Grades:
7th - 9th
Types:
Also included in: Math 8 Unit 19 Fractions, Percents, and Statistics
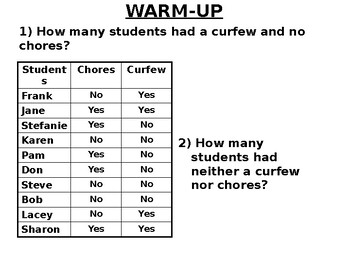
Math 8 19.1 Put Data into Venn Diagrams and Frequency Tables
This editable lesson was written by Alex Benn using the concepts described in his book Tenacious-Teaching: Uniting Our Superpowers to Save Our Classrooms and his website: Tenacious-Teaching.com. It includes an introductory warm-up designed to remediate the required prerequisite knowledge; concise notes; tasks that require escalating effort; numerous examples to prevent misconceptions; and in-class practice problems to promote mastery. It does not include answers to the tasks provided. Those are
Subjects:
Grades:
7th - 9th
Types:
Also included in: Math 8 Unit 19 Fractions, Percents, and Statistics
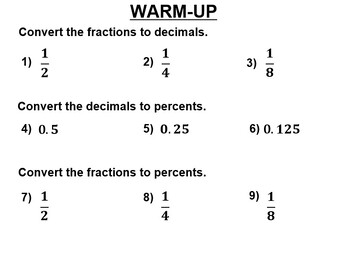
Math 8 19.3 Fractions to Decimals to Percents
This editable lesson was written by Alex Benn using the concepts described in his book Tenacious-Teaching: Uniting Our Superpowers to Save Our Classrooms and his website: Tenacious-Teaching.com. It includes an introductory warm-up designed to remediate the required prerequisite knowledge; concise notes; tasks that require escalating effort; numerous examples to prevent misconceptions; and in-class practice problems to promote mastery. It does not include answers to the tasks provided. Those are
Subjects:
Grades:
7th - 9th
Types:
Also included in: Math 8 Unit 19 Fractions, Percents, and Statistics
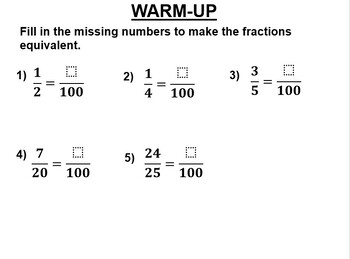
Math 8 19.2 Convert Fractions to Percents
This editable lesson was written by Alex Benn using the concepts described in his book Tenacious-Teaching: Uniting Our Superpowers to Save Our Classrooms and his website: Tenacious-Teaching.com. It includes an introductory warm-up designed to remediate the required prerequisite knowledge; concise notes; tasks that require escalating effort; numerous examples to prevent misconceptions; and in-class practice problems to promote mastery. It does not include answers to the tasks provided. Those are
Subjects:
Grades:
7th - 9th
Types:
Also included in: Math 8 Unit 19 Fractions, Percents, and Statistics
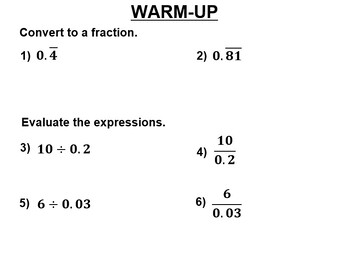
Math 8 19.5 More Repeating Decimals to Fractions
This editable lesson was written by Alex Benn using the concepts described in his book Tenacious-Teaching: Uniting Our Superpowers to Save Our Classrooms and his website: Tenacious-Teaching.com. It includes an introductory warm-up designed to remediate the required prerequisite knowledge; concise notes; tasks that require escalating effort; numerous examples to prevent misconceptions; and in-class practice problems to promote mastery. It does not include answers to the tasks provided. Those are
Subjects:
Grades:
7th - 9th
Types:
Also included in: Math 8 Unit 19 Fractions, Percents, and Statistics
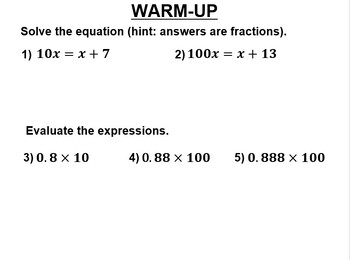
Math 8 19.4 Repeating Decimals to Fractions
This editable lesson was written by Alex Benn using the concepts described in his book Tenacious-Teaching: Uniting Our Superpowers to Save Our Classrooms and his website: Tenacious-Teaching.com. It includes an introductory warm-up designed to remediate the required prerequisite knowledge; concise notes; tasks that require escalating effort; numerous examples to prevent misconceptions; and in-class practice problems to promote mastery. It does not include answers to the tasks provided. Those are
Subjects:
Grades:
7th - 9th
Types:
Also included in: Math 8 Unit 19 Fractions, Percents, and Statistics
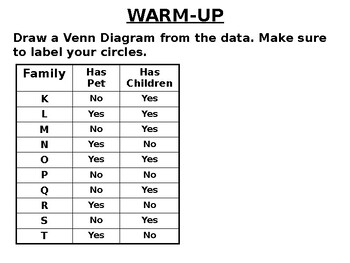
Math 8 Review Unit 19 Fractions Percents Statistics
This editable lesson was written by Alex Benn using the concepts described in his book Tenacious-Teaching: Uniting Our Superpowers to Save Our Classrooms and his website: Tenacious-Teaching.com. It includes an introductory warm-up designed to remediate the required prerequisite knowledge; concise notes; tasks that require escalating effort; numerous examples to prevent misconceptions; and in-class practice problems to promote mastery. It does not include answers to the tasks provided. Those are
Subjects:
Grades:
7th - 9th
Types:
Also included in: Math 8 Unit 19 Fractions, Percents, and Statistics
Experimental versus Theoretical Probability Activity
Probability and Statistics Activity for testing Experimental and Theoretical Probabilities in the classroom.Can be completed in groups or individually. Students will pull "tiles" from a bag or box or any container available, and write their findings down. Using this data, they will answer probability questions about their experiment.Students will then empty their container of "tiles" and count the actual amount of tiles. Using this data, the students will answer probability questions about the t
Subjects:
Grades:
Homeschool
Types:
Lecture Slides (Chapter 7) Data, Probabilities, and Predictions
Lecture notes on understanding data, distributions, descriptive statistics, probabilities, predictions, laws of probabilities, the law of large numbers, expectations, payoffs, risk aversion, conditional probability, statistical inference, and some applications in sustainability and environmental modeling.
Subjects:
Grades:
10th - 12th, Higher Education

Real Numbers
Much of this material should be familiar to you, but some of it may be new. Although it is only a language or set of rules to help you deal with statistics, without it you will not be able to make sense of the following chapters. Before you continue, make sure you have completed all the learning activities and understood what you have done.
Subjects:
Grades:
7th - 9th

Mean, Median, Mode, and Range Lesson
This is a PowerPoint that explains how to find the mean, median, mode, and range. In this lesson, there is a choice board that contains activities for different learning styles based on Howard Gardner's Multiple Intelligence.
Subjects:
Grades:
4th - 8th
Types:

Intro to Mean Absolute Deviation
This PowerPoint explains what mean absolute deviation is and how to find it. Gives some easy practice sets for students. I created this while teaching 6th grade mathematics to help my students understand the concept. My district required me to introduce the topic, and wanted students to have a general understanding of how to find the mean absolute deviation, so the PowerPoint does not go too deep.
Subjects:
Grades:
6th - 9th
AP Statistics 03.1.1: Bivariate (two-variables) Scatterplots
Objectives:
-Given a two-variable data set, construct and interpret a scatterplot.
-Identify variables as explanatory or response variables.
-Describe an association in terms of:
*Direction
*Shape (or form)
*Strength
Reference Text:
The Practice of Statistics, First Edition.
Yates, Moore, McCabe
http://www.whfreeman.com/Catalog/static/whf/yates/
Subjects:
Grades:
10th - 12th, Higher Education
AP Statistics 01.1.1: Describing Distributions Visually
Objectives:
-State whether a variable is categorical or quantitative.
-Manually create a dotplot and a histogram that represent given data.
-Describe a distribution in terms of center, spread and shape.
Reference Text:
The Practice of Statistics, First Edition.
Yates, Moore, McCabe
http://www.whfreeman.com/Catalog/static/whf/yates/
Subjects:
Grades:
10th - 12th, Higher Education

Baseball Salaries! | Comparing 2 or More Numerical Distributions
Suppose you want to compare two or more numerical distributions. The best way to do this is by creating parallel boxplots. This lesson accomplishes this with explicit TI-84 keystroke instructions. In addition to learning how to construct parallel boxplots on a graphing calculator, students will additionally learn the following from participation in this activity:· the relationship between a boxplot and its corresponding histogram.· how to distinguish right skewness from left skewness using onl
Subjects:
Grades:
10th - 12th, Higher Education
AP Statistics 06.2.1: Probability Basics
Probability Basics
Objectives:
-Write the sample space for a set of events.
Count the outcomes in a sample space by using:
**A branching (tree) diagram.
**The multiplication principle.
-Apply the basic rules of probability to solve problems.
-Describe what is meant by the complement of an event.
-Describe what it means to say that two events are disjoint.
**Use the addition rule for disjoint events to answer “or” probability questions.
Reference Text:
The Practice of Statistics, First Edition.
Subjects:
Grades:
10th - 12th, Higher Education
AP Statistics 02.2.1: The Standard Normal Distribution
Objectives:
-State mean and standard deviation for The Standard Normal Distribution
-Given a raw score from a normal distribution, find the standardized “z-score”
-Use the Table of Standard Normal Probabilities to find the area under a given section of the Standard Normal curve.
Reference Text:
The Practice of Statistics, First Edition.
Yates, Moore, McCabe
http://www.whfreeman.com/Catalog/static/whf/yates/
Subjects:
Grades:
10th - 12th, Higher Education
AP Statistics 05.2.1: Designing Experiments
Designing Experiments
Objectives:
-Describe the difference between an observational study and an experiment.
-Draw a schematic diagram of a completely randomized experiment that allows comparison between a treatment group and a control group.
-State the three principles of experimental design.
-Describe what is meant by “statistically significant”.
-Describe what is meant by a “double blind” experiment.
Reference Text:
The Practice of Statistics, First Edition.
Yates, Moore, McCabe
http://www.
Subjects:
Grades:
10th - 12th, Higher Education
Organizing and Visualizing Data: Population, Sample, Frequency, Graphs and Plots
z
Subjects:
Grades:
8th - 12th
CCSS:
AP Statistics 06.3.1: Conditional Probability
Conditional Probability
Objectives:
-Recognize whether a conditional probability problem calls for the use of the “or” case rules or the “and” case rules.
-Apply the “or” case rules for disjoint and dependent cases.
-Apply the “and” case rules for independent and dependent cases.
Reference Text:
The Practice of Statistics, First Edition.
Yates, Moore, McCabe
http://www.whfreeman.com/Catalog/static/whf/yates/
Subjects:
Grades:
10th - 12th, Higher Education
Data Mining HANDS ON First Workflow
This is a free resource that serves as a primer to learn how to setup and use the Python visual programming tool Orange used in the lessons (HANDS ON tutorials and student exercises) for the Data Mining curriculum.
Grades:
10th - 12th, Higher Education
Also included in: Data Mining HANDS ON Bundle
Showing 1-24 of 123 results


