138 results
Statistics lessons for Microsoft PowerPoint and for homeschool
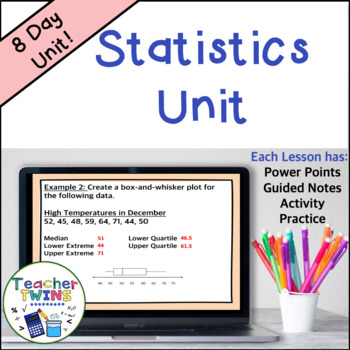
Statistics Unit - Mean Absolute Deviation - Populations and Samples - Box Plots
Make lesson planning easy with this no-prep Statistics - Mean Absolute Deviation - Populations and Samples - Box-and-Whisker Plots Unit! Included are 8 ready-made lessons to teach finding mean absolute deviation as well as interpreting and creating box-and-whisker plots. This unit is very easy to use and will save you a lot of time! Your students will learn how to find mean absolute deviation and interpret box-and-whisker plots by using our editable PowerPoints with guided notes. Students will l
Subjects:
Grades:
6th - 8th
Also included in: 7th Grade Math Curriculum Bundle
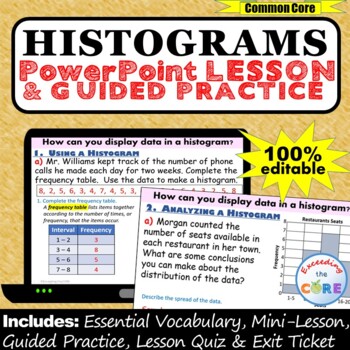
HISTOGRAMS and FREQUENCY TABLES PowerPoint Lesson AND Guided Practice - DIGITAL
Great for online learning and distance learning!Get your students successfully creating and using HISTOGRAMS and Frequency Tables with this PowerPoint Presentation. This lesson begins with a focused mini-lesson and guided practice questions. It concludes with a lesson quiz and exit ticket to assess student understanding. All of the answers are included. This PowerPoint presentation is 100% editable, therefore you can modify any slide as needed.What is Included:_ Mini-Lesson with Guided Practice
Subjects:
Grades:
6th - 8th
CCSS:
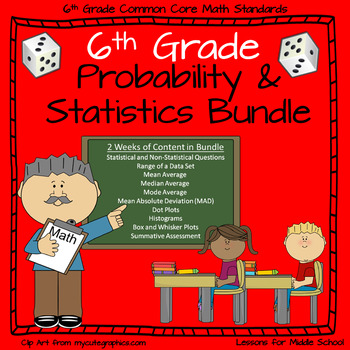
6th Grade Math -Probability and Statistics Bundle
6th Grade Math – Probability and Statistics Bundle - 9 LessonsThis COMPREHENSIVE bundle covers all of the 6th Grade Common Core Math Standards. This is a comprehensive unit so the teacher will only have to download the product and then print out copies with their students. This bundle is part of our 6th Grade Yearlong Math Curriculum. ABSOLUTELY NO PREP REQUIRED, just download and start teaching in minutes. Our preview product is an example of how each individual lesson in the unit is struct
Subjects:
Grades:
5th - 7th
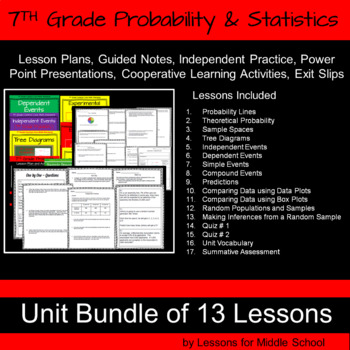
7th Grade Math - Probability and Statistics Bundle
This unit covers all of the 7th Grade Common Core Math Standards associated with Probability. This COMPREHENSIVE bundle has 13 Lessons with 429 Pages. ABSOLUTELY NO PREP REQUIRED, just download and start teaching in minutes. This unit is part of our 7th Grade Year Long Curriculum. INCLUDED WITH EACH LESSON➯Lesson Plan➯Power Point Presentation➯Warm Up Activity➯Guided Note➯Cooperative Learning Structure➯Independent Practice➯Exit Slip➯Answer Sheets included****************************************
Subjects:
Grades:
6th - 8th
6th Grade Statistics & Data 5 - Box and Whisker Plot Powerpoint Lesson
Sixth Grade Statistics 5 - Box and Whisker Plot Powerpoint Lesson is powerful when used as direct instruction in the classroom, online or individually. It teaches students all the skills necessary to make a box and whisker plot: mean, median, lower quartile Q1, upper quartile Q3, inter quartile range, range, minimum and maximum numbers. Students then are shown how to take this information and build a box and whisker plot. Finally, students are taught how to analyze the box and whisker plot th
Subjects:
Grades:
6th, Adult Education
Also included in: 6th Grade Statistics & Data Bundle - 6 Powerpoint Lessons - 402 Slides
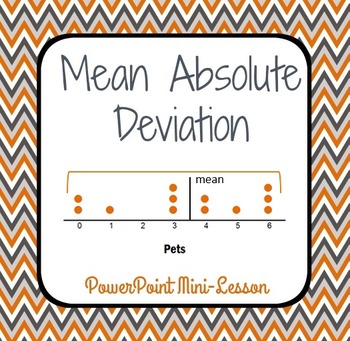
Mean Absolute Deviation - PowerPoint Mini Lesson Introduction
This PowerPoint mini-lesson introduces your students to the concept of the Mean Absolute Deviation (M.A.D.). It's presented in kid-friendly language, and it walks your students through the process, one step at a time. Most of the calculations use nice, whole numbers. The visual models will help your students understand the concept while they calculate this measure of variation.Check out the Preview file, so you understand what you're receiving on these 15 slides.Want a follow up activity here
Subjects:
Grades:
5th - 6th
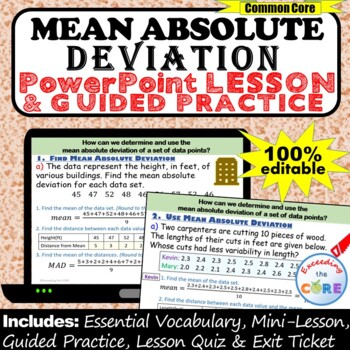
MEAN ABSOLUTE DEVIATION (MAD) PowerPoint Lesson & Practice | Distance Learning
Great for online learning and distance learning!Get your students successfully finding the MEAN ABSOLUTE DEVIATION (MAD) with this PowerPoint Presentation. This lesson begins with a focused mini-lesson and guided practice questions. It concludes with a lesson quiz and exit ticket to assess student understanding. All of the answers are included. This PowerPoint presentation is 100% editable, therefore you can modify any slide as needed.What is Included:_ Mini-Lesson with Guided PracticeThe mini-
Subjects:
Grades:
5th - 7th
6th Grade Statistics & Data 1 - Statistical Questions & Types of Data Lesson
Sixth Grade Statistics 1 - Statistical Questions and Types of Data Powerpoint Lesson is powerful when used as direct instruction in the classroom, online, or individually. It teaches students how to recognize and pose a statistical question. Students also learn the difference between numerical and categorical data. They also learn the 4 basic steps in presenting data: posing a statistical question, gathering the data, displaying the data, and answering the question they posed. There are 22
Subjects:
Grades:
6th, Adult Education
CCSS:
Also included in: 6th Grade Statistics & Data Bundle - 6 Powerpoint Lessons - 402 Slides
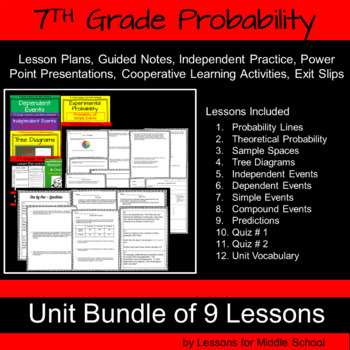
7th Grade Math - Probability Bundle
This unit covers all of the 7th Grade Common Core Math Standards associated with Probability. This COMPREHENSIVE bundle has 9 Lessons with 300+ Pages. ABSOLUTELY NO PREP REQUIRED, just download and start teaching in minutes. This unit is part of our 7th Grade Year Long Curriculum.INCLUDED WITH EACH LESSON➯Lesson Plan➯Power Point Presentation➯Warm Up Activity➯Guided Note➯Cooperative Learning Structure➯Independent Practice➯Exit Slip➯Answer Sheets included*******************************************
Subjects:
Grades:
6th - 8th
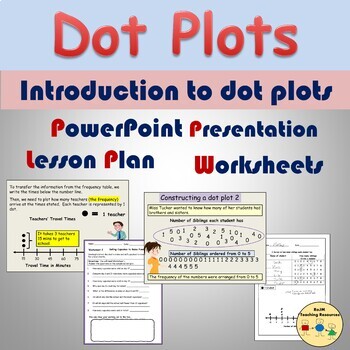
Dot Plots Line Plots Worksheets Presentation Frequency Tables Statistics
This resource relates to statistics on the topic of dot plots. It introduces dot plots on PowerPoint (12 Slides). The presentation demonstrates how the data was collected, rearranging data in numerical order, and presenting the data on a frequency table. Using the information on the frequency table, students are shown how to create a dot plot/line plot via Slide Show animation. Two detailed examples are shown. Content:· PowerPoint Presentation (12 Slides)· 1 Flexible Lesson Plan (1- 2 hrs)· 2 Se
Subjects:
Grades:
3rd - 5th

IB Psychology Internal Assessment (IA) Analysis and Statistics Slides
Walk your students through the Analysis section of the Internal Assessment (IA). Google slides include content and background information on statistics, directions and links for students to follow while they write their Analysis section, create their table and graph, and run descriptive statistics and inferential statistics with their raw data. Includes links to online calculators for mean, standard deviation, Mann Whitney U Test, Wilcoxon Test. Analysis rubric and links to two IA exemplars incl
Subjects:
Grades:
9th - 11th, Higher Education, Adult Education
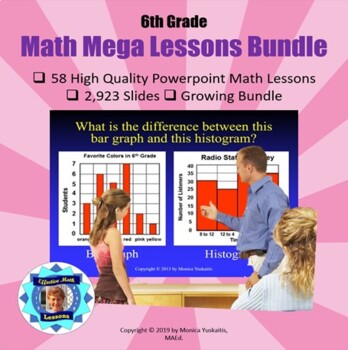
6th Grade Powerpoint Mega Math Bundle - 58 Lessons - 2923 Slides
Sixth Grade Powerpoint Math Bundle is composed of 58 different high quality math powerpoint lessons comprising 2,923 slides. These are perfect for distance learning on Zoom or similar formats. On top of that they are powerful when used as direct instruction in the classroom.There are 22 strategies of effective teaching based on research in these powerpoint lessons. . For further information on each lesson click on them individually. This is a growing bundle which means as new products are a
Subjects:
Grades:
6th, Adult Education

Statistics and Probability Practice Problems (MSM)
If you are looking for extra practice problems for statistics and probability standards within 6th grade math, you are in the right place! You will be getting a google slideshow for each standard under statistics and probability that have multiple practice problems, using peardeck. The slides can also be modified to be conducted by the teacher without using the peardeck extension by simply deleting the peardeck attachments. The answers for each problem are in the speaker notes on each slide.*All
Subjects:
Grades:
6th
Also included in: 6th Grade Math Standards-Based Practice Problems
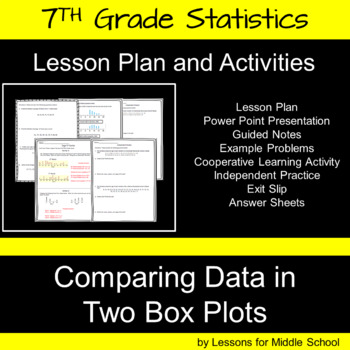
7th Grade Math - Statistics - Comparing Data in Two Box Plots (CCSS Aligned)
This lesson focuses on teaching students to compare data shown in two box plots according to the 7th Grade Common Core Math Standards. Students will be presented with data displayed in two box plots and students must use their understanding of the following to compare the data presented. ➯Maximum Values ➯Minimum Values ➯Median ➯Interquartile ➯Outliers ABSOLUTELY NO PREP REQUIRED, just download and start teaching in minutes. Students will compare the shap
Subjects:
Grades:
6th - 8th
CCSS:
Also included in: 7th Grade Math - Probability and Statistics Bundle
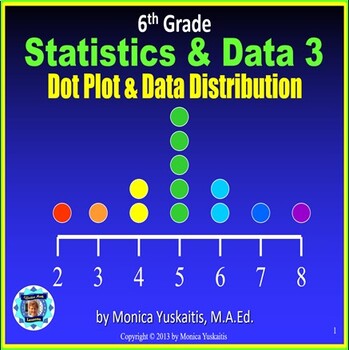
6th Grade Statistics & Data 3 - Dot Plot and Data Distribution Powerpoint Lesson
Sixth Grade Statistics 3 - Dot Plot and Data Distributions Powerpoint Lesson - is powerful when used as direct instruction in the classroom, online, or individually. It teaches students how to read and create dot plots. In addition, students learn to analyze the data as to its center, spread, and most common numbers. There are 22 strategies of effective teaching based on research. For best results, students should have white boards and dry erase markers. For instructions on how to successf
Subjects:
Grades:
6th, Adult Education
CCSS:
Also included in: 6th Grade Statistics & Data Bundle - 6 Powerpoint Lessons - 402 Slides
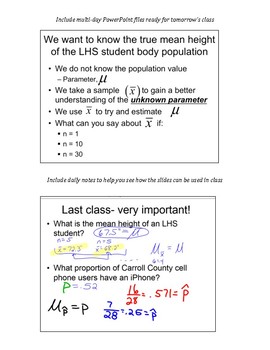
AP Statistics Stats Sampling Distributions Central Limit Theorem CLT tests keys
This is a large unit covering all things with sampling distributions. This includes three multi day powerpoint files, many handouts, two quizzes, a test (and answer keys).
The answer keys for handouts, tests and quizzes are included. I've also included my daily class notes so you can see how the powerpoint files can be used in class.
Subjects:
Grades:
10th - 12th, Higher Education
Statistics, Topic 6: The Binomial Probability Distribution Lesson Plan
Welcome to a statistical journey like no other! Prepare to be captivated as we dive into the fascinating world of numbers, patterns, and probabilities in Topic 6: The Binomial Probability Distribution and Related Topics Lesson Plan. In this immersive lesson plan, spanning an exhilarating 116 slides, you'll embark on a thrilling adventure through animated visuals and thought-provoking problems. Get ready to unlock the secrets of data analysis, explore the depths of probability theory, and unravel
Subjects:
Grades:
11th - 12th
Also included in: Basic Statistics Year Long Lesson Plan Bundle
Statistics, Topic 9: Hypothesis Testing Lesson Plan
Welcome to a statistical journey like no other! Prepare to be captivated as we dive into the fascinating world of numbers, patterns, and probabilities in Topic 9: Hypothesis Testing Lesson Plan. In this immersive lesson plan, spanning an exhilarating 86 slides, you'll embark on a thrilling adventure through animated visuals and thought-provoking problems. Get ready to unlock the secrets of data analysis, explore the depths of probability theory, and unravel the mysteries of statistical inference
Subjects:
Grades:
11th - 12th
Also included in: Basic Statistics Year Long Lesson Plan Bundle

Statistics, Topic 8: Estimation Lesson Plan
Welcome to a statistical journey like no other! Prepare to be captivated as we dive into the fascinating world of numbers, patterns, and probabilities in Topic 8: Estimation Lesson Plan. In this immersive lesson plan, spanning an exhilarating 93 slides, you'll embark on a thrilling adventure through animated visuals and thought-provoking problems. Get ready to unlock the secrets of data analysis, explore the depths of probability theory, and unravel the mysteries of statistical inference. From b
Subjects:
Grades:
11th - 12th
Also included in: Basic Statistics Year Long Lesson Plan Bundle
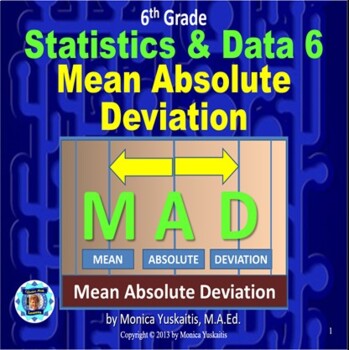
6th Grade Statistics & Data 6 - Mean Absolute Deviation Powerpoint Lesson
Sixth Grade Statistics 6 - Mean Absolute Deviation Powerpoint Lesson is powerful when used as direct instruction in the classroom, online or individually. It teaches students the steps to take to find the Mean Absolute Deviation of a set of data. The skills necessary to do this task are reviewed: how to find the mean, how to find absolute values of numbers, and how to add and subtract integers. There are 22 effective teaching strategies based on research used in this lesson. For best resul
Subjects:
Grades:
6th, Adult Education
Also included in: 6th Grade Statistics & Data Bundle - 6 Powerpoint Lessons - 402 Slides
Statistics, Topic 4: Correlation and Regression Lesson Plan
Welcome to a statistical journey like no other! Prepare to be captivated as we dive into the fascinating world of numbers, patterns, and probabilities in Topic 4: Correlation and Regression. In this immersive lesson plan, spanning an exhilarating 99 slides, you'll embark on a thrilling adventure through animated visuals and thought-provoking problems. Get ready to unlock the secrets of data analysis, explore the depths of probability theory, and unravel the mysteries of statistical inference.
Subjects:
Grades:
11th - 12th
Also included in: Basic Statistics Year Long Lesson Plan Bundle
Statistics, Topic 7: Normal Curves and Sampling Distributions Lesson Plan
Welcome to a statistical journey like no other! Prepare to be captivated as we dive into the fascinating world of numbers, patterns, and probabilities in Topic 7: Normal Curves and Sampling Distributions Lesson Plan. In this immersive lesson plan, spanning an exhilarating 315 slides, you'll embark on a thrilling adventure through animated visuals and thought-provoking problems. Get ready to unlock the secrets of data analysis, explore the depths of probability theory, and unravel the mysterie
Subjects:
Grades:
11th - 12th
Also included in: Basic Statistics Year Long Lesson Plan Bundle
Statistics, Topic 3: Averages and Variations Lesson Plan
Welcome to a statistical journey like no other! Prepare to be captivated as we dive into the fascinating world of numbers, patterns, and probabilities in Topic 3: Averages and Variations. In this immersive lesson plan, spanning an exhilarating 165 slides, you'll embark on a thrilling adventure through animated visuals and thought-provoking problems. Get ready to unlock the secrets of data analysis, explore the depths of probability theory, and unravel the mysteries of statistical inference. F
Subjects:
Grades:
11th - 12th
Also included in: Basic Statistics Year Long Lesson Plan Bundle
Statistics, Topic 2: Organizing Data Complete Lesson Plan
Welcome to a statistical journey like no other! Prepare to be captivated as we dive into the fascinating world of numbers, patterns, and probabilities in Topic 2: Organizing Data. In this immersive lesson plan, spanning an exhilarating 108 slides, you'll embark on a thrilling adventure through animated visuals and thought-provoking problems. Get ready to unlock the secrets of data analysis, explore the depths of probability theory, and unravel the mysteries of statistical inference. From basic c
Subjects:
Grades:
11th - 12th
Also included in: Basic Statistics Year Long Lesson Plan Bundle
Showing 1-24 of 138 results


