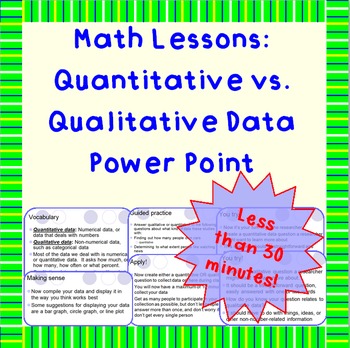
Qualitative vs. Quantitative Data - A Power Point Lesson
Mad Eye Moody Productions
1.1k Followers
Grade Levels
6th - 8th
Subjects
Resource Type
Formats Included
- Zip
Pages
10 pages
Mad Eye Moody Productions
1.1k Followers
What educators are saying
A great resource to teach the differences between qualitative and quantitative data. My students really struggle with these terms, so the definitions and this lesson really helped clarify things. Thank you!
Description
This short, 8-slide presentation is the perfect way to introduce your students to the difference between qualitative and quantitative data. Has vocabulary, guided practice, and an interactive piece where students create their own data collection question and then poll classmates. Students display the data in a format of their own choosing.
NOT CCSS-aligned
File is in .pptx (2010 Show) format.
If you decide to purchase, please leave me comments about this product. Thank you for your business and feedback!
Other statistics resources you may find helpful:
Finding Mean Median Mode and Range Power Point Lesson
Bar graphs Power Point presentation
Basic standard deviation distribution curves and statistics Power Point
Circle Graphs Power Point Lesson
Double bar graphs and horizontal bar graphs Power Point
Line graphs and scatter plots Power Point Presentation Lesson
Qualitative vs Quantitative Data Power Point Lesson
Statistics Power Point Lessons
Stem and Leaf Diagrams and Line Plots Power Point Lesson
Stock Market and Statistics Class Project
Total Pages
10 pages
Answer Key
N/A
Teaching Duration
45 minutes
Report this resource to TPT
Reported resources will be reviewed by our team. Report this resource to let us know if this resource violates TPT’s content guidelines.


