12 results
Not grade specific statistics homework
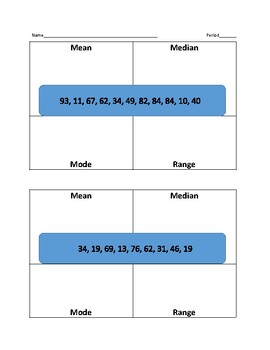
Measures of Center Packet
This 8 page packet gives students 16 data sets of varying size. For each, students must calculate mean, median, mode, and range. Perfect practice pages for SLIFE, ESL, or SPED students.
Subjects:
Grades:
Not Grade Specific
Types:
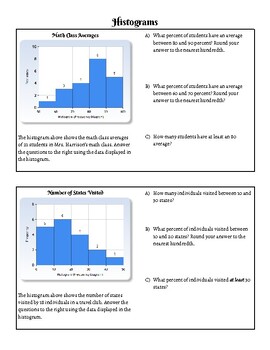
Histogram Practice Sheet
Aligned to the Algebra 1 NYS Next Gen Learning Standards- NY-6.SP4: Display quantitative data in plots on a number line, including dot plots, and histograms.This is a practice sheet to help students master histograms. Students will interpret the data from two histograms, and then construct their own histogram to represent a set of data. Designed to take about 20 minutes to complete
Subjects:
Grades:
Not Grade Specific
Types:
CCSS:
Computing the Variance and Standard Deviation of Grouped Data
Students read instructions on how to analyze the spread of a set of grouped data using the formulas for variance and standard deviation. Then students get to try their hand at computing the variance and standard deviation of other sets of data.
Subjects:
Grades:
Not Grade Specific
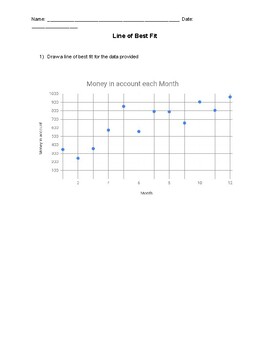
Line of Best Fit Worksheet
Draw line of best fit and answer questions about it for a set of data
Subjects:
Grades:
Not Grade Specific
Types:
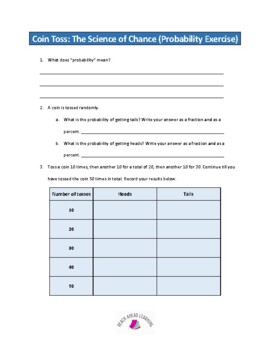
Coin Toss: The Science of Chance (Probability Exercise)
This activity will teach students about probability, randomness, The Law of Probability and The Gambler's Fallacy. It will encourage students to analyze and reflect.
Subjects:
Grades:
Not Grade Specific
Types:

Animals coloring book for kids
Animal Coloring Book for 3-6-Year-Old Kids (Future Teacher's Coloring Books for 3-6-Year-Old Kids).This fantastic and creative coloring book for children.
Subjects:
Grades:
Not Grade Specific
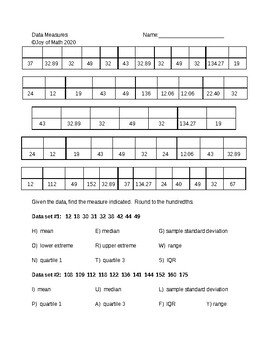
Data Measures
This is a short self-checking quote puzzle that is to be used as a quick practice. The data measures that are to be calculated include mean, median, sample standard deviation, range, quartile 1, quartile 3, and IQR. It can be completed with or without the use of a calculator. The second side which is not part of the quote puzzle requires students to use a frequency table to calculate the data measures listed previously.
Subjects:
Grades:
Not Grade Specific
Types:
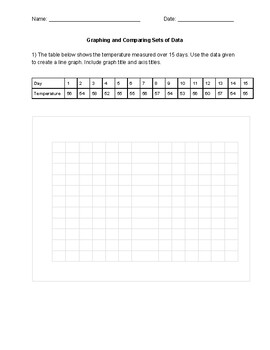
Graphing and Comparing Sets of Data Worksheet
Create, interpret, and compare graphs
Subjects:
Grades:
Not Grade Specific
Types:
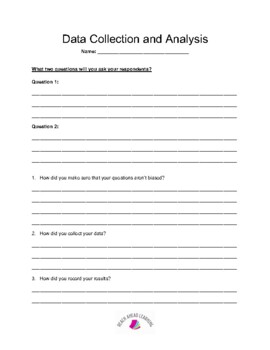
Data Collection and Analysis
This worksheet allows students to develop a questionnaire and gather data from their peers. Next, they are asked a series of questions which test their knowledge of data management and their ability to analyze the data.
Subjects:
Grades:
Not Grade Specific
Types:
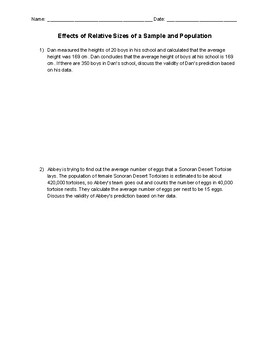
Effects of Relative Sizes of a Sample and Population Worksheet
Worksheet with problems involving sample size and population size when collecting data
Subjects:
Grades:
Not Grade Specific
Types:
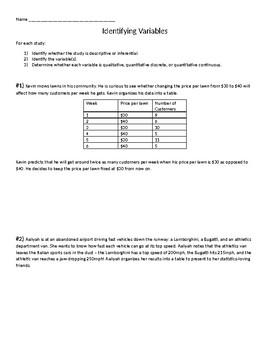
Statistics: Identifying & Analyzing Variables
Students explore a collection of statistical studies with the purpose of identify and analyze the variables within.Students are asked to:1) Identify whether the study is descriptive or inferential.2) Identify variables in the study.3) Determine whether each variable is qualitative, quantitative discrete, or quantitative continuous.
Subjects:
Grades:
Not Grade Specific
Types:

PLANNER BINDER
PLANNER BINDERIt is the best solution to organize your time and change your bad habits. It is a personal commitment between you and yourself to reach a balanced life.
Grades:
Not Grade Specific
Types:
Showing 1-12 of 12 results


