Misleading Charts and Graphs Analysis
David Prince
29 Followers
Grade Levels
Not Grade Specific
Subjects
Resource Type
Formats Included
- Word Document File
Pages
4 pages
David Prince
29 Followers
What educators are saying
I love this activity with my students. It is very clear and helps students understand different ways graphs can be made misleading.
Description
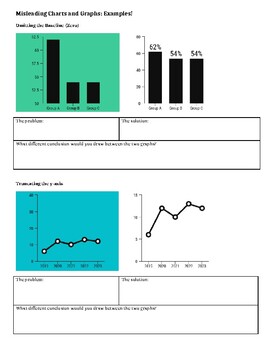
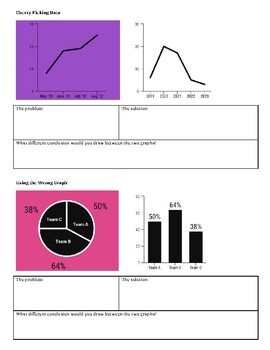
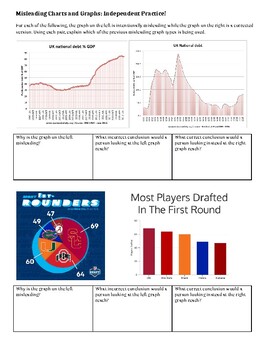
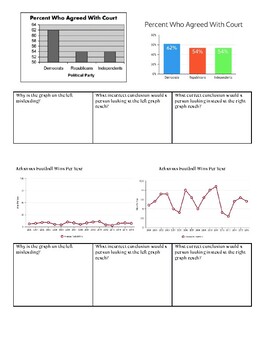
This lesson outlines the four most common ways that writers and journalists display graphs that can cause people to draw incorrect conclusions. Students look at examples of bad graphs along with corrected versions and explain why one version is misleading and the other is correct. Independent practice is provided for the students to demonstrate understanding as well.
Total Pages
4 pages
Answer Key
N/A
Teaching Duration
N/A
Report this resource to TPT
Reported resources will be reviewed by our team. Report this resource to let us know if this resource violates TPT’s content guidelines.


