63 results
Not grade specific graphing lessons
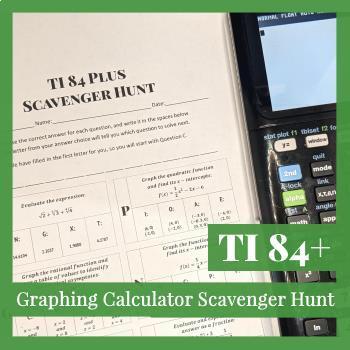
Graphing Calculator Lesson and Activity for the TI-84 Plus
Graphing Calculator Scavenger Hunt for the TI-84+ Start the year off right! With this ready-to-go lesson, you can teach the foundational calculator skills students will need in all of their math classes in just 1-3 days. Topics include:Evaluating ExpressionsRadicals (Square Roots, Cube Roots, etc.)Fractions vs. DecimalsScientific NotationDegrees vs. RadiansGraphing Linear FunctionsGraphing Quadratic FunctionsGraphing Rational FunctionsFinding x-Intercepts/RootsFinding the VertexFinding Vertical
Subjects:
Grades:
Not Grade Specific
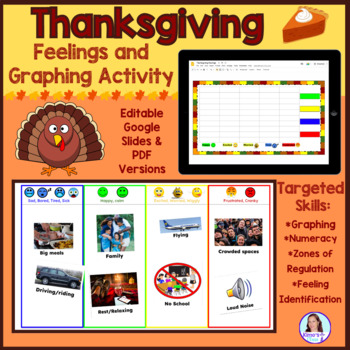
Thanksgiving Feeling and Graphing Lesson | SEL | Zones of Self Regulation
This Thanksgiving themed lesson will allow you to work on social emotional learning and graphing at the same time!Holidays and breaks from school can be exciting but often bring many other emotions as well. This lesson will go over some general Thanksgiving traditions and allow your students to identify how those traditions/activities make them feel. The graphing portion is meant to be done as a group lesson to target numeracy skills as well as depict the feelings of peers/classmates. This helps
Grades:
Not Grade Specific
Types:
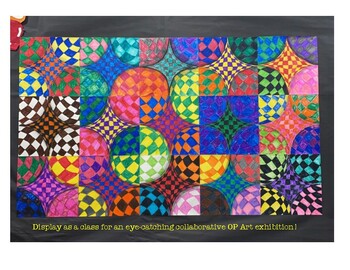
How to Draw an OP Art Parabolic Curve (Collaborative OP Art Class Display!)
OP Art... where MATH meets ART. Your students will love how easy it is to create an eye-catching OP art drawing. Your admin will love the cross-curricular connection and class collaboration. This download includes a 5-page packet. Pages 1-4 are steps to create the parabolic curve. Page 5 is an example of what each artwork looks like when they are displayed together. I print out this packet to give to students as we go through the steps together on my document camera. We use markers to color in t
Subjects:
Grades:
Not Grade Specific
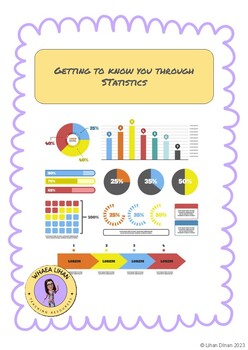
Getting to know you through statistics
Getting to know you through statistics, getting to know your students at the beginning of the teaching year can often resort to the tried and true activities. Why not try something new and find out more about your students likes/dislikes, interests, hobbies through learning. This resources supports you and your students to work through statistics, and working through the PPDAC cycle. It gives you options for making graphs as well as using digital platforms to create your graphs and show your dat
Subjects:
Grades:
Not Grade Specific
Types:
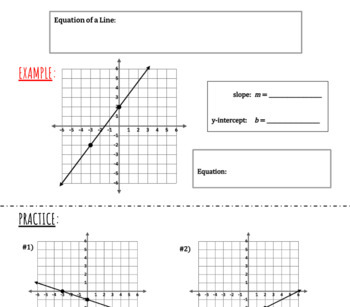
Writing the equation of a line in slope-intercept form.
**This lesson is editable on google slides to fit your classroom needs and can be downloaded to a pdf. Students practice finding the slope and y-intercept of a line graphically. Then they practice writing the equation of a line in slope-intercept form (y=mx+b). Included: -4 warm-up questions identifying slope and y-intercept.-1 example finding slope and y-intercept. Then substituting into the equation.-6 practice questions: finding slope and y-intercept. Then substituting into the equation.
Grades:
Not Grade Specific
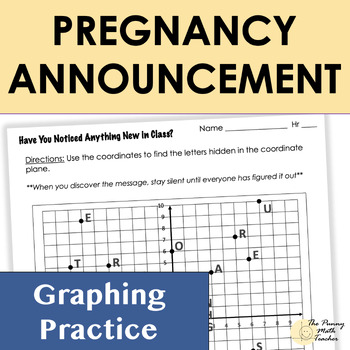
Graphing Practice PREGNANCY ANNOUNCEMENT
Surprise your classes with this fun activity! Students will find the coordinates and write the corresponding letter down to discover the secrete message! I used it in the last 5 minutes of class while I passed out tests to review answers. This engaged them, surprised them, and kept them patient for their tests :) Plus we all got distracted then afterwards. I was pregnant! Can your students keep the secret from the next class? Mine did pretty well at keeping the secret. Email me your pregnancy an
Subjects:
Grades:
Not Grade Specific
Types:
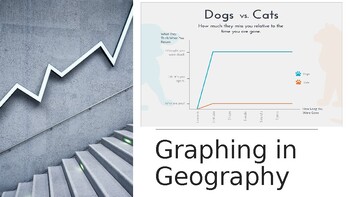
Graphing in Geography (3 different types)
Students will learn how to to put data into 3 different types of graphs (X/Y Scattergraph, Pie Chart, and Proportional area graphs with examples and a final task.
Subjects:
Grades:
Not Grade Specific
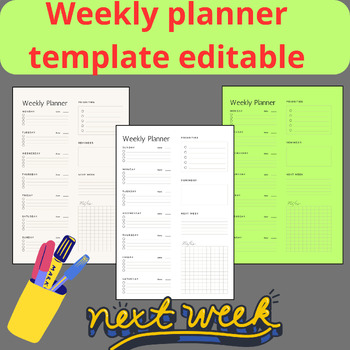
Weekly planner template editable _ Editable daily weekly teacher planner digital
The weekly planner template is a useful tool for organizing and managing tasks, appointments, and activities throughout the week. This editable weekly planner template provides the flexibility to customize and adapt the design to suit your specific needs and preferences. Here is a description of a typical editable weekly planner template: 1. Layout: The template usually features a clean and organized layout with the days of the week arranged horizontally from Monday to Sunday. 2. Editable Fi
Subjects:
Grades:
Not Grade Specific
Types:
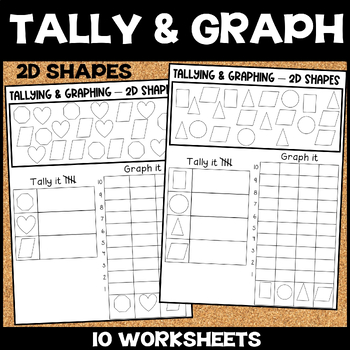
Tallying and Graphing, 2D Shape Tallying and Graphing, Graphing Activities
10 Graphing & Tallying Worksheets
Subjects:
Grades:
K - 2nd, Not Grade Specific
Types:
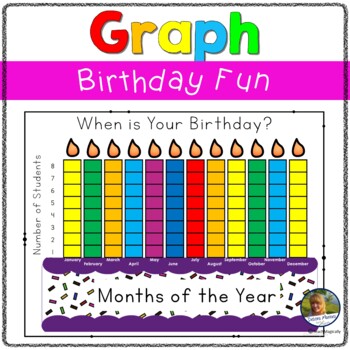
Birthday Display Math Bar Graph Back to School
Get ready for back to school with this birthday chart. This easy math bar graph birthday display will make birthdays so much easier. It contains a bar graph birthday display with a bar graph lesson plan. Use the bar graph lesson plan to create a birthday display poster for small spaces. and keeps you ready for those birthday celebration. Checkout the preview.Includes✔Cover Page✔Graph Colored Poster (copy paper sized)✔Info. Page✔Lesson Plan✔Resource Page✔Terms of Use✔About the AuthorCustomer Tips
Subjects:
Grades:
Not Grade Specific
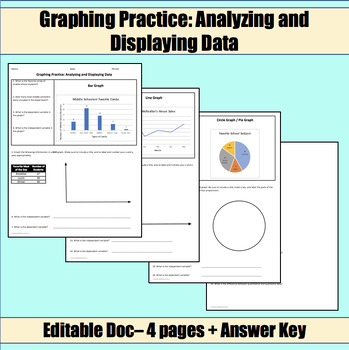
Graphing Practice: Analyzing and Displaying Data
In this Graphing Practice: Analyzing and Displaying Data Activity, students will be able to practice analyzing different graphs, as well as make their own graphs based on information they are given. This includes an opportunity to practice with: Bar GraphsLine GraphsCircle Graphs / Pie GraphsThis Graphing Practice: Analyzing and Displaying Data Activity can be used as:Introductory LessonNotesSub lesson / reviewStation workIndependent workHomeworkCheck out my other introduction to science lessons
Subjects:
Grades:
Not Grade Specific
Types:
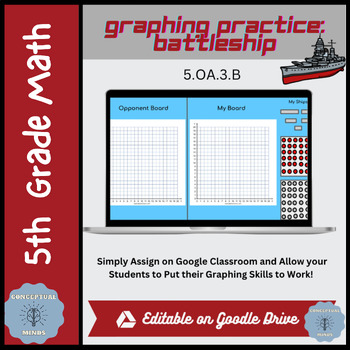
Battleship Game Graphing Practice
What a FUN way to learn! My students loved playing board games.. especially Battleship. The best part about the game is that students are working on a coordinate plane without even realizing it! You can assign this game to students on google classroom to use during work time, homework, or even free play. Enjoy! Check out these related resources: Follow Directions on a Coordinate Plane: Are We There Yet?Graphing Ordered Pairs PracticeCoordinate Plane Travel Plans
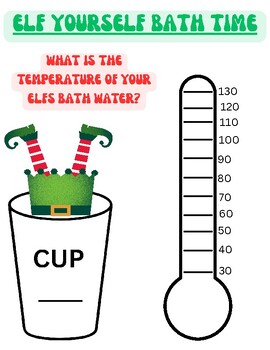
ELF Bath Time Science and Water Experiment
A great way to tie in your elf on the shelf with a science and water standard! Place out 3 (or as many as you want) cups with different temperatures. Tell your students to pick a cup and stick the thermometer inside. Then they have to graph the temperature on their worksheet!
Subjects:
Grades:
Not Grade Specific
Types:
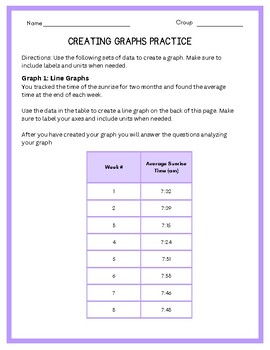
Bar and Line Graph Practice
Students work through creating a line graph and a bar graph with analysis questions to accompany
Grades:
Not Grade Specific
Graphing Basics Slideshow
This slideshow takes students through the basics of learning how to graph bar and line graphs. This presentation includes vocab, steps to create a graph, and practice graphs.
Grades:
Not Grade Specific
Math Sparks: Data Analysis PowerPoint and Student Notes Newly Revised
Do you need a little spark to your math lessons? Math Sparks - Data Analysis will give your students just that!This easy to use, NO PREP PowerPoint reviews key facts and rules about graphs and charts.Newly revised with PowerPoint Corrections, Condensed Student Notes with Fast Facts already entered (a great time-saver), and Bonus Worksheets!Topics include: Reading a Table, Using Numbers in a Table, Using a Price List, Finding Mean/Median/Mode, Working with Graphs, Reading a Circle Graph, Reading
Subjects:
Grades:
Not Grade Specific
Also included in: Math Sparks Bundle Two! Basic Math Skills! $$ Savings!
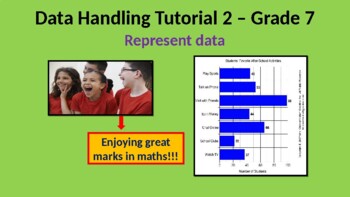
Grade 7 Representing and interpreting data in PowerPoint
Data cycle - problem, plan, collect & organize, represent, analysis & report. Keywords - bar & double bar graphs, histogram, pie chart, frequency tables, representing data, examples, intervals, data set, sectors of a whole, critical reading and interpreting, assumptions, writing paragraphs, summarizing & proposals. Excellent for classroom teaching and for use with a mobile.
Subjects:
Grades:
6th - 8th, Not Grade Specific
Also included in: Grade 7 Maths Data handling in animated PowerPoint.

5 Projects to Integrate Technology in Math Lessons
What's included in the Math bundle: * Five step-by-step lessons, including reproducibles, grading rubrics, sample projects, extensions for advanced students and troubleshooting tips where applicable * A brief summary of each project, including suggested grade level and prior knowledge, time required, software required * Higher-order thinking skills addressed * Technology-specific skills taught (including ISTE)Projects include: Keeping a Timecard in Excel, Beginning Graphs with Excel,
Subjects:
Grades:
Not Grade Specific
Types:
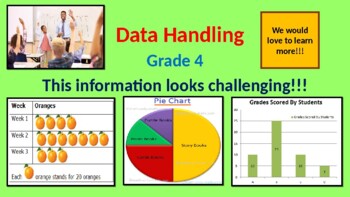
Grade 4 Data handling in PowerPoint
collection & handling of data, key words, different graphs - bar, pie charts & fractions, data cycle, assignment, experimentation & probability. Excellent for classroom teaching with a data projector and for use on a mobile phone.
Subjects:
Grades:
3rd - 5th, Not Grade Specific
Also included in: Grade 4 Maths Space, shape and data handling in animated PowerPoint.
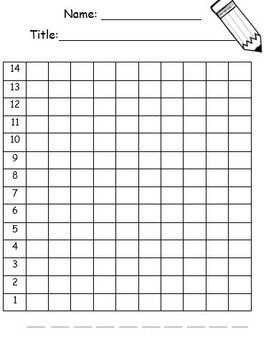
Printable Graphs
Use these graphs for gathering data. This set includes a tally chart and bar graph option. I have used this with my students when studying graphing, gathering data for experiments, getting to know our class and more. These graphs have fill in the blank spots to fill in the appropriate data. Be sure to check out my other products from Katie's Creative Classroom! Enjoy :)
Subjects:
Grades:
Not Grade Specific
Types:

Grade 7 Data handling - probability in PowerPoint
History, gambling, outcomes, experiments, event, frequency, possible outcomes, tallies, equal chance, formula for probability, example test question. Excellent for use in classroom with data projector and for use on mobile phone.
Subjects:
Grades:
6th - 8th, Not Grade Specific
Also included in: Grade 7 Maths Measurement and probability in animated PowerPoint.
Grade 7 Collecting, organizing, summarizing and using data in PowerPoint.
Data cycle, what is data, sources, examples, keywords - data, population, sample, questionnaires & questions, raw data, frequency table, tallies, intervals, range of data values, completing tables, stem-and- leaf method, exercises, maths percentages, working with intervals, summarizing data - mode, median, bi-mode, mean, measures of dispersion, range, central tendency, formula for mean, measuring dispersion. Excellent for classroom teaching wit a data projector & for use on a mobile.
Subjects:
Grades:
6th - 8th, Not Grade Specific
Also included in: Grade 7 Maths Data handling in animated PowerPoint.
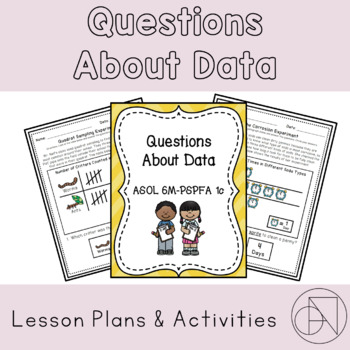
Questions About Data (Special Education)
ASOL 6M-PSPFA 1: The student will c) answer a question related to the collected data from an experiment, given a model of data, or from data collected by the student.I originally designed this Special Education/ Math packet for the 6th Grade VAAP (Virginia Alternate Assessment Program). However, the differentiation I included throughout the activities makes this resource accessible for many others, too! Take a look at the previews to see if this would be a good fit for you and your students. Thi
Subjects:
Grades:
Not Grade Specific
Types:
Also included in: 6th Grade VAAP Bundle
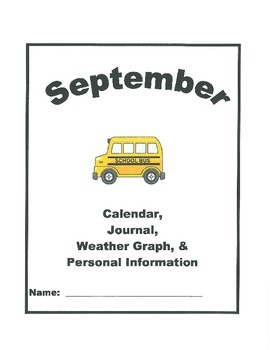
Calendar, Weather Graph, Journal, and Personal Information Unit for 2014-15
This unit contains calendars for each month from September 2014-August 2015. Each calendar has questions below to answer about the calendar. There is a cover sheet for each month. We use this with our life skills 7th and 8th graders, but this could be used for regular education students in lower grades. We make a packet each month that has a calendar page and a journal page for each school day and one weather graph in the front, right behind the cover sheet. They complete the weather graph
Subjects:
Grades:
Not Grade Specific
Types:
Showing 1-24 of 63 results


