47 results
Not grade specific statistics assessments
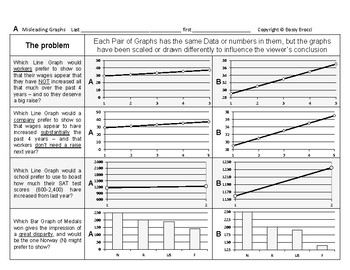
Stats&Data 14: Misleading & Misinterpreting Data Graphs Charts Statistics
This is an excerpt from my popular line ofBossy Brocci Math & Big Science workbooks on Amazon.ANSWER KEY included=======================Students will:1) Analyze 20 different Graphs or Data Displays2) Draw Conclusions & Answer questions about theaccuracy, fairness, limitations & legitimacy of those Graphs3) Answer 16 Multiple-choice questionsbased on their Calculations & Observations4) Be compelled to show their work in a neat & orderly format5) Be trained to methodically &
Subjects:
Grades:
Not Grade Specific
Types:
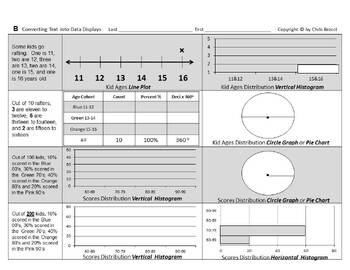
Stats&Data Bundle C: Data Displays Measures of Central Tendency & Variation
From the Author of Bossy BrocciMath & Big Science workbooks on Amazon,this Bundle of Data Displays,Measures of Central Tendency(Mean, Median, Mode & Range);and Measures of Variation(Quartiles, Interquartile Range, Outliers & Box Whisker plots)contains:11 Lessons32 Worksheets832 Problems & Tasks- and Assessment up the a$$=======================Answer KEYS included=======================Coverage Specifics:#1 Identify & Select Common Typesof Data DisplaysStudents will:1) Identi
Subjects:
Grades:
Not Grade Specific
Types:
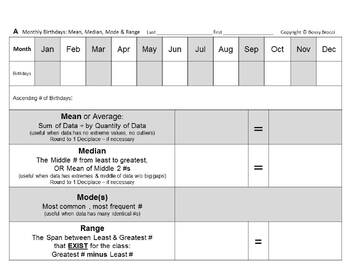
Stats&Data Bundle B: Birthdays Data Displays Variation Mean Median Mode Range
From the Author of Bossy BrocciMath & Big Science workbooks on Amazon,this Birthdays Stats (Mean, Median, Mode, Range),Measures of Variation & Data Displays Bundlecontains:2 Lessons12 Worksheets294 Problems & Tasks- and Assessment up the a$$=======================Answer KEY included=======================Coverage Specifics:#1 Author's Numbers Birthdays ProjectStudents will:1) Convert the given Monthly Birthdaysfrom Mr. Brocci's School numbers into:Ascending List/Data SetMeanMedianMod
Subjects:
Grades:
Not Grade Specific
Types:
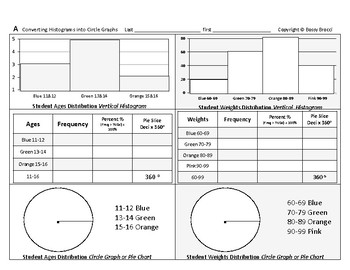
Stats&Data 03: Convert Histograms into Circle Graphs Construct Create Pie Charts
This is an excerpt from my popular line ofBossy Brocci Math & Big Science workbooks on Amazon.Answer KEY included=======================Students will:1) Convert 3 Vertical Histograms into3 Data Tablesand3 Colored or Shaded Circle Graphs (Pie Charts)2) Convert 1 Horizontal Histogram into1 Data Tableand1 Colored or Shaded Circle Graph (Pie Chart)3) Be compelled to show their work in a neat & orderly format4) Be trained to methodically & systematicallyPresent Data in different DisplaysN
Subjects:
Grades:
Not Grade Specific
Types:
Stats&Data Bundle D: Misleading Misinterpreting Surveys Statistics Graphs Charts
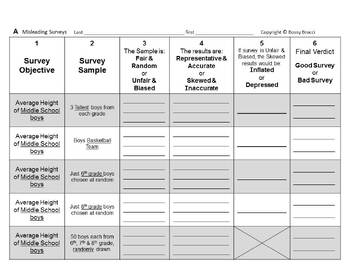
From the Author of Bossy BrocciMath & Big Science workbooks on Amazon,this Bundle onMisleading & MisinterpretingSurveys, Statistics, and Graphs/Chartscontains:2 Lessons8 Worksheets78 Problems & Tasks- and Assessment up the a$$=======================Answer KEYS included=======================Coverage Specifics:#1 Misleading & Misinterpreting Surveys & Statistics+ QUIZStudents will:1) Read 10 different Surveys and Survey Samples2) Determine and Write if those Surveys are:Fair
Subjects:
Grades:
Not Grade Specific
Types:
Stats&Data 13: Misleading & Misinterpreting Surveys & Statistics + QUIZ
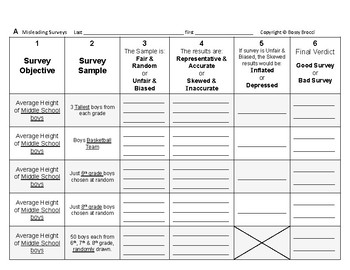
This is an excerpt from my popular line ofBossy Brocci Math & Big Science workbooks on Amazon.ANSWER KEY included=======================Students will:1) Read 10 different Surveys and Survey Samples2) Determine and Write if those Surveys are:Fair & RandomUnfair & BiasedRepresentative & AccurateSkewed & InaccurateInflatedDepressedGood SurveyBad Survey3) Answer 24 Multiple-choice questionsbased on their Observations4) Analyze 5 Statistical Problems & Conclusions for accuracy
Subjects:
Grades:
Not Grade Specific
Types:
Stats&Data 09: Draw Statistical Conclusions from Box and Whisker Box Plots QUIZ
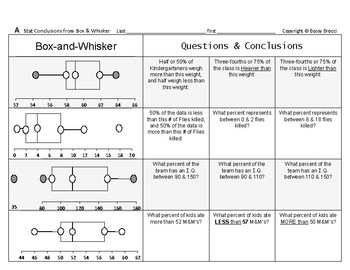
This is an excerpt from my popular line ofBossy Brocci Math & Big Science workbooks on Amazon.Answer KEY included=======================Students will:1) Analyze 8 Box & Whisker Plots (Box Plots)2) Answer at total of 24 questionsfrom those Plots regarding variousFraction & Percent Distribution portions3) Be compelled to show their work in a neat & orderly format4) Be trained to methodically & systematicallyTranslate or Convert Box & Whisker Plotsinto Fractions & Percen
Subjects:
Grades:
Not Grade Specific
Types:
Stats&Data 06: Variation Quartiles Interquartile Range Outliers Box Whisker Plot
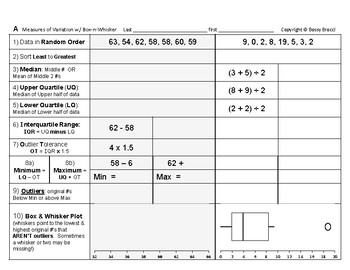
This is an excerpt from my popular line ofBossy Brocci Math & Big Science workbooks on Amazon.Answer KEY included=======================Students will:1) Sort or Sequence 8 different Data Sets or Sets of Numbers2) Calculate & Identify for each of the 8 Data Sets the:MedianUpper QuartileLower QuartileInterquartile RangeOutlier ToleranceAllowed MinimumAllowed Maximumandany Outliers3) Draw or Construct the Box and Whisker Plots (Box Plots)directly beneath their calculations4) Be compelled to
Subjects:
Grades:
Not Grade Specific
Types:
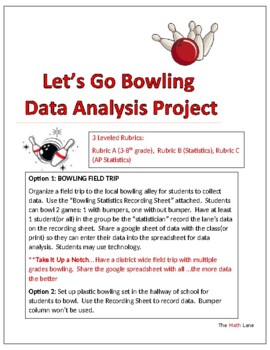
Let's Go Bowling Statistics STEM Project & Field Trip (3-12 and AP Stat)
Great END OF YEAR project. Get ready to strike up some fun with your students on a field trip to the bowling alley or right in your own hallway with a plastic bowling set! This isn't just any ordinary field trip - it's a real-world data collection extravaganza. 3 different leveled rubrics (Grade 4-10, Statistics, AP Statistics) so students can analyze the data based on their math knowledge. Students will be able to practice creating and analyzing graphical displays, scatterplots, construct c
Subjects:
Grades:
Not Grade Specific
Types:
Also included in: High School Statistics Project Bundle
Statistics Multiple Choice Exams; Randomized & Preselected Qs
These are the available tests.Statistics Review (40 Random Qs)Multiple Choice Exam 01 (40 Preselected Qs)Multiple Choice Exam 02 (40 Preselected Qs)Multiple Choice Exam 03 (40 Preselected Qs)The download will have the URL, username, and password to the Canvas online testing system.After you log in, you will be able to take the stats assessmentsYour account will stay active for 6 monthsIf you use Canvas as your testing platform, this quiz can be installed, administered, will self-grade, and updat
Subjects:
Grades:
Not Grade Specific
Types:
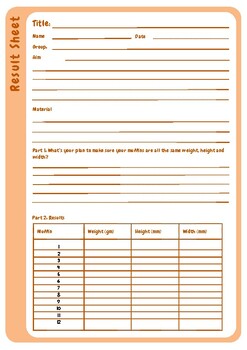
Consistency Confections: A Muffin-Baking Exploration in Product Quality
Embark on a delectable journey with 'Consistency Confections: A Muffin-Baking Exploration in Product Quality.' In this engaging activity, participants delve into the world of product consistency, a critical factor in commercial success. By immersing themselves in the art of muffin baking, participants work collaboratively in groups to select and implement methods ensuring uniform size and shape.Each group meticulously measures their muffins, and through thoughtful data analysis, participants eva
Subjects:
Grades:
Not Grade Specific
Types:
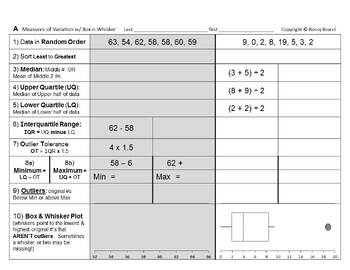
Stats&Data Bundle A: Box Whisker Box Plots & Measures of Variation bundle
Spun-off from my popular series of Bossy Brocci Math & Big Science Workbooks on Amazon,this Measures of Variation Box & WhiskerBox Plots Bundlecontains:4 Lessons10 Worksheets263 Problems & Tasks- and Assessment up the a$$=======================Answer KEYS included=======================Coverage Specifics:#1 From Quartiles Interquartile Range& Outliers to Box Whisker PlotsStudents will:1) Sort or Sequence 8 different Data Sets or Sets of Numbers2) Calculate & Identify for each
Subjects:
Grades:
Not Grade Specific
Types:
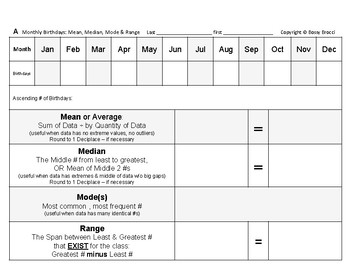
Stats&Data 11: YOUR Birthdays Variation Central Tendency Data Displays Project
This is an excerpt from my popular line ofBossy Brocci Math & Big Science workbooks on Amazon.=======================Students will:1) Convert a Monthly Birthdays tallyfrom YOUR School or Class(es)into:Ascending List/Data SetMeanMedianModeRangeUpper QuartileLower QuartileInterquartile RangeOutlier ToleranceAllowed MinimumAllowed MaximumOutliersBox & Whisker PlotVertical Bar GraphLine GraphStem & Leaf PlotLine Plot (X Plot)Data TableCircle Graph (Pie Chart)andVertical Histogram2) Be co
Subjects:
Grades:
Not Grade Specific
Types:
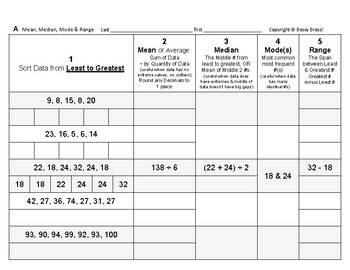
Stats&Data 05: Calculate Measures of Central Tendency Mean Median Mode & Range
This is an excerpt from my popular line ofBossy Brocci Math & Big Science workbooks on Amazon.Answer KEY included=======================Students will:1) Calculate Mean, Median, Mode and Rangefrom 10 different sets of Data or Numbers2) Be compelled to show their work in a neat & orderly format3) Be trained to methodically & systematically CalculateMeasures of Central Tendency Note: If you're looking for Box & Whisker Plots, then see my Stats&Data Lessons 06, 07, 08 and 09=====
Subjects:
Grades:
Not Grade Specific
Types:
Level 2 Data Handling
This is an introduction to Data Handling for teenagers and adults with additional educational needs. It is a full course and includes student worksheets and teaching slides.The resource is intended to introduce students to the data handling, including:Introduction to data handlingDescribing dataConstructing graphsData handling projectThese worksheets are designed to cover the following learning outcomes:(1) Identify uses of data in everyday life, e.g. price comparisons, surveys(2) Identify basic
Subjects:
Grades:
Not Grade Specific
Types:
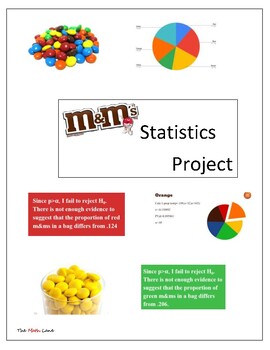
M&M Statistics 1 sample Proportion Hypothesis Test Project/Activity No Prep
Get ready to "yummify" your statistics class with this no prep project that will have your students conducting proportion hypothesis tests using everyone's favorite treat - M&Ms! Perfect for statistics or AP Statistics classes, this project offers two exciting options for implementation. For an engaging in-class activity, simply give each group a bag of M&Ms and watch as they compare proportions across groups or have students take a handful from a large bag to create their own sample. Th
Subjects:
Grades:
Not Grade Specific
Types:
CCSS:
Also included in: High School Statistics Project Bundle
Level 1 Data Handling
This is an introduction to Data Handling for teenagers and adults with additional educational needs. It is a full course and includes student worksheets, teaching slides and extras.The resource is intended to introduce students to basic data handling skills, including:Data in everyday lifeGathering dataShowing and presenting dataThese worksheets are designed to cover the following learning outcomes:(DH1) Identify the use of data in everyday life, e.g. the numbers of people who want tea/coffee(DH
Subjects:
Grades:
Not Grade Specific
Types:
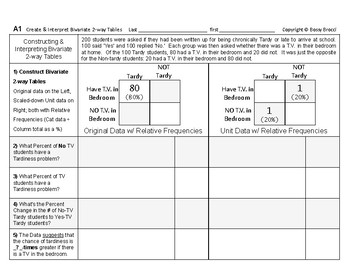
Stats&Data 12: Construct & Analyze Bivariate Two-way Frequency Data Tables
This is an excerpt from my popular line ofBossy Brocci Math & Big Science workbooks on Amazon.ANSWER KEY included=======================Students will:1) Construct a Pair of Raw and Unit/SimplifiedBivariate Two-way Tablesfrom 4 different Word Problems/Scenariosfor a total 8 Tables created2) Calculate Relative Frequencies3) Answer 16 Statistical (Fraction/Percent) questions- four from each scenario -directly underneath the Bivariate Two-way Tables4) Draw 4 Vertical Bar Graphs using their calcu
Subjects:
Grades:
Not Grade Specific
Types:
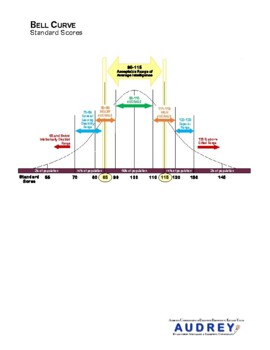
Special Education Evaluation Bell Curve SpEd Evaluation Diagnostician
Graphic to help explain standard scores to parents. See my other listings with the full version that contains information for parents.
Subjects:
Grades:
Not Grade Specific
Types:

Real NFL Super Bowl Word Problems
Pictures and 21 real-life historical word problems where students can determine operation to answer statistical problems.
Subjects:
Grades:
Not Grade Specific
Types:
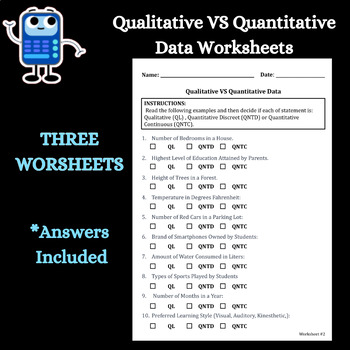
Qualitative VS Quantitative Data Multiple Choice Worksheet (Solutions Included)
Discover a dynamic way to engage students with our comprehensive "Quantitative vs. Qualitative Worksheet Set"! This set of three worksheets, meticulously crafted for educators, challenges students to discern between qualitative, quantitative discrete, and quantitative continuous data types. Perfect for reinforcing data literacy and critical thinking skills, this resource encourages active learning in the classroom.Key Features:30 thought-provoking questions to assess understanding.Clear instruct
Subjects:
Grades:
Not Grade Specific
Types:
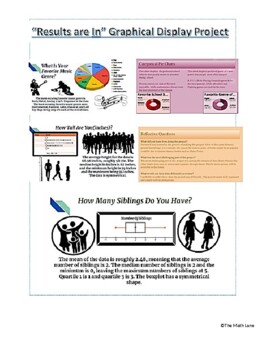
"The Results are In" Graphical Display Stats End of Year Project (All Grades)
Get ready to take your data analysis skills to the next level with our Graphical Display Project! Designed for students who want to create visually stunning displays of their data, this project allows you to not only collect data using Google Surveys, but also analyze and present it using Google Sheets. With detailed instructions, project examples, and a comprehensive rubric included, you'll have everything you need to create professional-looking graphical displays of both numerical and categori
Subjects:
Grades:
Not Grade Specific
Types:
CCSS:
Also included in: High School Math Projects (Algebra II and Statistics) STEM No prep
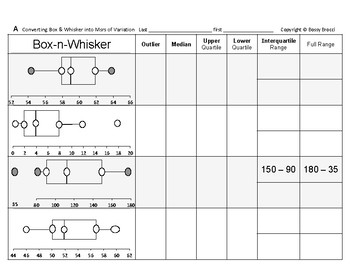
Stats&Data 07: Convert Box Whisker Plots Quartiles Interquartile Range Outliers
This is an excerpt from my popular line ofBossy Brocci Math & Big Science workbooks on Amazon.Answer KEY included=======================Students will:1) Analyze 8 Box & Whisker Plots (Box Plots)2) Identify:OutlierMedianUpper QuartileLower QuartileInterquartile RangeandFull Rangefrom each Box & Whisker Plot3) Be compelled to show their work in a neat & orderly format4) Be trained to methodically & systematically Analyzeand Convert Box & Whisker Plots into Measures of Varia
Subjects:
Grades:
Not Grade Specific
Types:
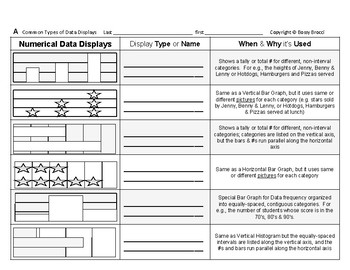
Stats&Data 01: Identify & Select Common Types of Data Displays
This is an excerpt from my popular line ofBossy Brocci Math & Big Science workbooks on Amazon.Answer KEY included=======================Students will:1) Identify and Label various Data Displays, including: Vertical Bar GraphVertical PictographHorizontal Bar GraphHorizontal PictographVertical HistogramHorizontal HistogramLine Plot (X Plot)Stem and Leaf PlotCircle Graph or Pie ChartandLine Graph2) Read about and Learn the appropriate usagefor each of those Data Displays3) Be compelled to show
Subjects:
Grades:
Not Grade Specific
Types:
Showing 1-24 of 47 results


