1,159 results
2nd grade graphing lessons
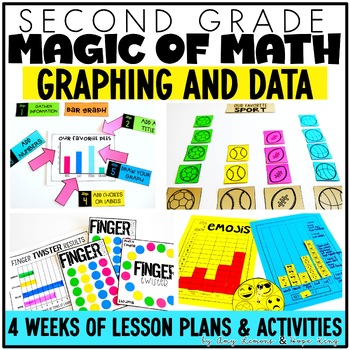
2nd Grade Magic of Math Data & Graphing Activities Bar Graphs & Picture Graphs
Graphing in 2nd grade made easy with hands-on bar graph, pictograph, and line plot activities! A complete curriculum for teaching students to interpret data and graphs, plus templates and a graphing project!The Magic Of Math Unit 8 for SECOND GRADE focuses on: Week 1: Bar Graphs Week 2: Pictographs Week 3: Line Plots Week 4: Word Problems Here is what is included in this two-week-long unit for 2nd grade: -Daily Lesson Plans for 20 days-Aligned with the 2nd Grade Common Core and TEKS-20
Grades:
2nd
Types:
Guided Math 2nd Grade 2-Digit and 3-Digit Addition and Subtraction Unit 4
Guided Math Whole Group and Teacher-Led Small Group Lessons 2nd Grade Download the Free Standards-Alignment for Guided Math2-Digit and 3-Digit Addition and Subtraction 2-Digit addition without regrouping (using strategies) 2-Digit subtraction without regrouping (using strategies) 2-Digit addition with regrouping2-Digit subtraction with regroupingAdding three 2-Digit numbersAdding four 2-Digit numbers3-Digit addition without regrouping3-Digit subtraction without regrouping3-Digit addition with re
Subjects:
Grades:
2nd
Types:
Also included in: Second Grade Guided Math Bundle
Guided Math 2nd Grade Addition and Subtraction Strategies Unit 3
Guided Math Whole Group and Teacher-Led Small Group Lessons 2nd Grade Download the Free Standards-Alignment for Guided MathAddition and Subtraction StrategiesThis unit provides key strategies for second graders to gain flexible and accurate computation. Addition to 20 strategies to build automaticitySubtraction to 20 strategies to build automaticityDoubles and near doublesAdding three numbersMaking 10 to addWord problemsRelated FactsPart part wholeResult unknownChange unknownBalancing across th
Subjects:
Grades:
2nd
Types:
Also included in: Second Grade Guided Math Bundle
Grade 2, Unit 3: Data Literacy (Ontario Mathematics)
The Grade 2, Unit 3: Data Literacy resource is a 100+-paged resource designed to meet the 2020 Ontario Mathematics curriculum expectations for Strand D: Data. This unit introduces students to concrete graphs, pictographs, and tally charts. Students learn how to read and interpret graphs and draw conclusions based on pre-made graphs. Students also create simple surveys involving 2 - 4 options, conduct the survey, and collect and interpret data. Please note this is a printable resource. There is N
Subjects:
Grades:
2nd
Types:
Also included in: Grade 2 Wonderland Mathematics: The Bundle (Ontario 2020 Math)
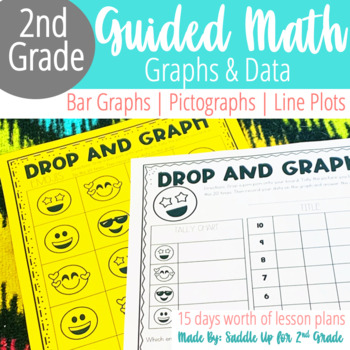
2nd Grade Graphing & Types of Graphs: Bar Graphs, Pictographs, & Line Plots
Do you need engaging 2nd grade guided math lessons and resources? This pack of 2nd grade graphing lesson plans is filled with hands-on engagement and interactive notebook activities! These PRINT & GO lesson plans will help you teach various types of graphs such as bar graphs, pictographs, and line plots. This 2nd grade guided math unit comes with 3 weeks worth of done-for-you lesson plans to teach types of graphs and data. These 2nd grade graphing activities were created to introduce, practi
Grades:
2nd
Types:
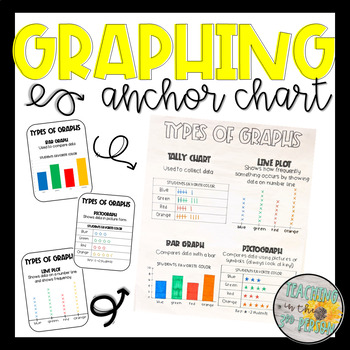
Types of Graphs Anchor Chart - Tally Chart, Bar Graph, Pictograph, Line Plot
Graphing made easy!Use these templates as a guide in creating your own anchor charts or print and use them in other helpful ways:Trace and create an anchor chart with studentsPrint on bright colored paper and use as postersShrink down and glue in student' math notebooks for a reference sheetPrint and send home as reference tools for students and parents (homework or tutoring)Earn Credit for Future Purchases:I appreciate each & every word of your valuable feedback. Also, if you leave feedback
Back to School MEGA Pack! {Grades 1-3}
This 89 page pack is FULL of engaging activities, printables and craftivities that are perfect to use those first couple of weeks with your new students! Activities are geared for grades 1-3. **DOWNLOAD THE PREVIEW FOR A PEAK AT MOST PAGES!**
There are activities to go along with the following books:
-Chrysanthemum
-Have You Filled a Bucket Today?
-Wemberly Worried
-I Like Myself!
-The Crayon Box That Talked
-A Bad Case of Tattle Tongue
Table of Contents:
Pg. 3: List of books needed
Pg.
Grades:
1st - 3rd
Types:
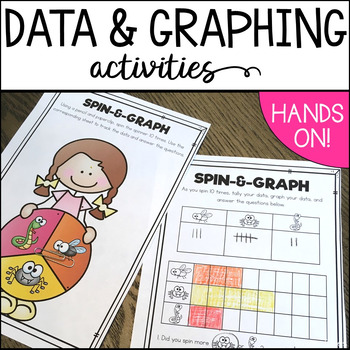
Data and Graphing Activities for First Grade
These data and graphing lessons, activities and printables have students using fun, hands on methods to analyze, collect and record data!GET THESE ACTIVITIES AND MORE BY PURCHASING MY MATH WORKSHOP BUNDLE FOR THE WHOLE YEAR! SEE MORE HERE!The objectives of these lessons, activities, and printables are:Students will be able to:- Collect data accurately.- Organize data using different types of graphs.- Compare and analyze data shown on different graphs.In this unit:Block graphs - hands on lesson a
Subjects:
Grades:
K - 2nd
Types:
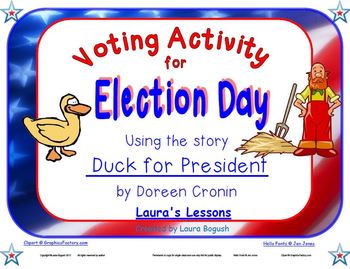
Voting Activity for Election Day Lesson using story Duck for President
A mock election is a great way to help young children understand the process of how we elect our leaders. This voting activity is the perfect lesson for use around Election Day for grades kindergarten, first, or second. Show an online video (link included in lesson) or read the book Duck for President by Doreen Cronen. A ballot is included for students to vote for who should be in charge of the farm: Duck or Farmer Brown. After ballots are collected, students work together to complete the
Subjects:
Grades:
K - 2nd
Types:
Guided Math 2nd Grade Graphs and Data Unit 8
Guided Math Whole Group and Teacher-Led Small Group Lessons 2nd Grade Download the Free Standards-Alignment for Guided MathGraphs and Data Unit FocusMake a T-ChartGraphs with three titlesGraphs with four titlesGraphs with five titlesOrganizing information Graphing information gainedGenerating and answering questions about graphsProbabilitySurveysBuilding graphs Transferring information to a graphProbabilityWho Is This Designed ForThis resource is for any general ed. teacher, instructional coach,
Subjects:
Grades:
2nd
Types:
CCSS:
Also included in: Second Grade Guided Math Bundle
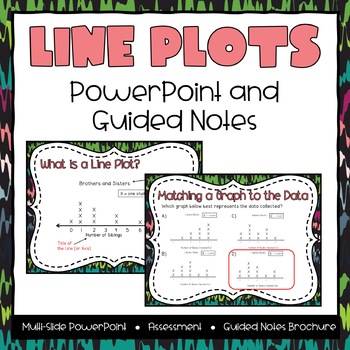
Line Plots Powerpoint & Guided Notes
This product features a 40 page eighties-themed powerpoint presentation that takes students step-by-step through the process how to analyze and interpret line plots using a variety of question types. The presentation includes these topics:- why do we use graphs?- parts of a line plot- reading and analyzing line plots- matching data to a graph- creating a line plot *1 & 2 step questions incorporated The product also comes with a tri-fold brochure that students can fill out while going through
Subjects:
Grades:
2nd - 4th
Common Core Aligned St. Patricks Day Lucky Charms Graphing MATH CENTER
This Unit is aligned with the following Common Core Standards:Standard (K.OA.1) – Represent addition and subtraction with objects, fingers, mental images, drawings, sounds, acting out situations, verbal explanations, expressions, or equations.Standard (K.OA.2) – Solve additions and subtraction word problems, and add and subtract within 10, e.g., by using objects or drawings to represent the problem.Standard (K.OA.5) - Fluently add and subtract within 5.Standard (K.CC.C.6)- Identify whether the
Subjects:
Grades:
PreK - 2nd
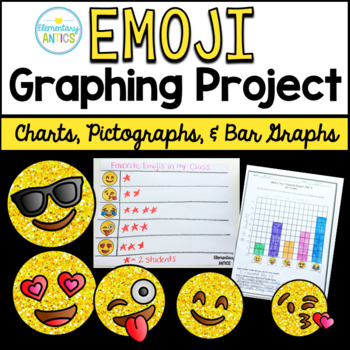
Emoji Graphs and Data Project {Charts, Pictographs, Bar Graphs}
This fun graphing project is a great way to introduce your students to collecting data and graphing- and the emojis keep them engaged and excited about learning!The Emoji Graphing Project includes 3 days of lesson plans!Part One: Conducting the SurveyPart Two: Making a Picture GraphPart Three: Create a Bar GraphAdditional Graphing Practice (3 more worksheets)Simple lesson plans are included for each part, but there is a ton of flexibility on how you can use this project in your classroom since y
Subjects:
Grades:
2nd - 3rd
Types:
2nd Grade Unit 7 Presentations: Data & Money; lessons 1-13
This is a collection of PowerPoints that will help you teach Unit/Module 7 for Second Graders. It includes slides for 13 lessons with problems and examples to effectively instruct your students and to keep pacing. Animations are provided to help you demonstrate different concepts if you do not have the items to use in class, for some.My PowerPoints can easily be saved as Google Slides after saving in Google Drive. It will present the same. You do not need to worry about having the same fonts a
Subjects:
Grades:
2nd
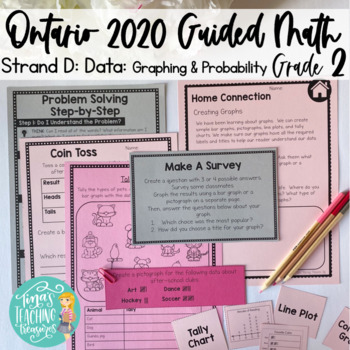
Ontario Grade 2 Math 2020 Strand D: Data : Sorting, Graphing, Mode, Probability
Fully updated to align with the 2020 Ontario Math Curriculum (40 more pages now included!!!)This product is designed to make your grade 2 Ontario math program simple, effective, and engaging! Keep your students learning with three-part lessons and lots of practice.All expectations for Strand D: Data (Graphing & Probability).1. Sorting2. Surveys & Creating Graphs3. Analyzing Graphs4. Mode5. ProbabilityEach set includes:Teacher notes including specific curriculum points coveredPosters to r
Subjects:
Grades:
2nd
Types:
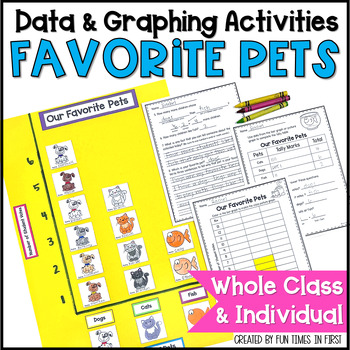
1st Grade Math Data & Graphing Activities - Graphing Our Favorite Pets
This 1st grade graphing activity is perfect for introducing data collection and analysis! Students will love working together as a class to create a large “Favorite Pets” graph. Help your 1st graders explore data analysis and graphing in a fun way with these activities! This resource covers data collection, picture graphs, bar graphs, tally tables and interpreting data. With a variety of options, you can choose which elements are best for your class to create the perfect graphing activity! This
Subjects:
Grades:
1st - 2nd
Types:
CCSS:
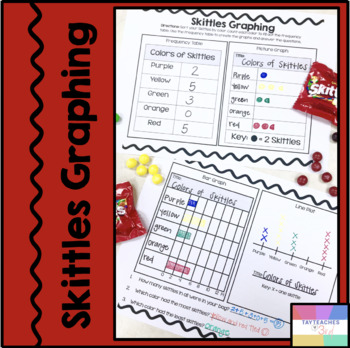
Skittles Graphing-Bar Graph, Line Plot, Picture Graph
This is a super fun activity to go along with your graphing unit. My students really struggle with following the key on a picture graph, so this was great practice! Includes: -2 Pages (to be printed front and back) Frequency Table (students sort skittles and fill in the table) Picture Graph, Key is counting by 2's, Students practice filling in the graph titles and pictures (some pictures will need to show half a skittle for odd number counts)Bar Graph, Scale is counting by 2's Line Plot Data Ana
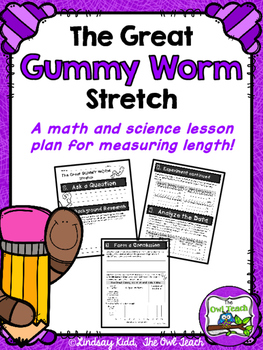
Measuring Length: {Measurement Science and Math Lab Activity}
This Measuring Length Activity is a hands-on, math and science integrated LAB, which takes students through the scientific method to measure the length of two different types of gummy worms in customary and metric units to see which type of candy worm stretches the greatest amount overall! This is easy to follow, fun, and a great way to practice measurement and data standards!
Included in this Packet:
-Teacher Directions (2 pages)
-Student Lab Sheet (4 pages)
-Grading Rubric (1 page)
Measurin
Subjects:
Grades:
1st - 4th
Types:
2nd Grade Unit 7 Presentations: Feet/Inches; Lesson 14-26
This is a collection of PowerPoints that will help you teach Unit/Module 7 for Second Graders. It includes slides for 12 lessons with problems and examples to effectively instruct your students and to keep pacing. Animations are provided to help you demonstrate different concepts if you do not have the items to use in class, for some.My PowerPoints can easily be saved as Google Slides after saving in Google Drive. It will present the same. You do not need to worry about having the same fonts a
Subjects:
Grades:
2nd
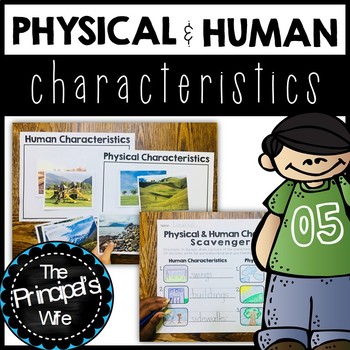
Physical and Human Characterisitics
These geography activities cover the difference between physical and human characteristics of a place. It was created as a cross curricular lesson; including social studies, math, and writing standards. A teacher's instruction page is include and describes how I use every activity in my classroom. The following standards are covered in these lessons:C3 Social Studies Standard:G2.0.1 Distinguish between physical (e.g., clouds, trees, weather) and human (e.g., buildings, playgrounds, sidewalks) c
Subjects:
Grades:
K - 2nd
Types:
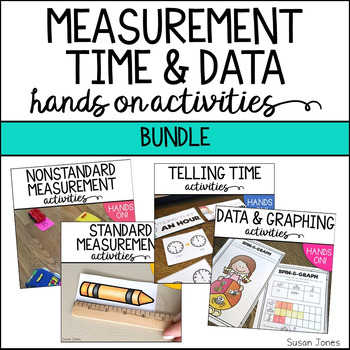
Measurement, Time, Graphing, and Data
This unit is filled with hands on lessons, activities, printables, and task cards to help your students with nonstandard measurement, standard measurement, telling time, collecting data and graphing!In this unit you will find:NONSTANDARD MEASUREMENT : 4 hands on lessons:-Car and Ramp Races-Stringy Shapes-Crooked Paths-Measure me! What’s wrong? – 8 different explanation tasks12 Nonstandard measurement task cards4 Practice pagesSTANDARD MEASUREMENT : 4 hands on lessons:-We Rule the Room-Block Towe
Subjects:
Grades:
K - 2nd
Types:
Pigeon Pack - Math, Writing and Art for Mo Willems' Books
This 32-page theme unit by Love to Learn is meant to be used with Mo Willems' popular Pigeon books. In this unit you will find:
- Art: crafts in which students cut out and put together the pigeon (with or without speech bubbles) and his bus.
- Math: Students count the number of items about which the pigeon is thinking.
- Graphing: As a class, students graph several questions about the pigeon (Which animal would be the best friend for the pigeon? What would be the best food for the pigeon? What
Subjects:
Grades:
K - 2nd
Types:
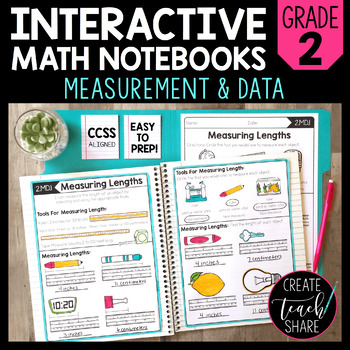
Math Interactive Notebook 2nd Grade Measurement and Data
What are Interactive Math Notebooks?
Interactive math notebooks are teaching pages used to introduce and teach new math concepts and skills. Each set of notebook pages includes definitions, explanations, rules, and/or algorithms that may be needed to address each standard. Sample and practice problems are also included to be used for guided practice. Once completed, these notebook pages serve as anchor charts for students to refer back to as a reference tool throughout the year.
How do I use
Subjects:
Grades:
1st - 3rd
Also included in: Math Interactive Notebook 2nd Grade Bundle
Gingerbread Man Eating Graphing Activity
Have fun with your PreK- Second grade students with this "What did I bite first?" graphing activity. Included in this pack is all the items you will need to make the gingerbread eating graphing activity, including the gingerbread men and the words.This activity is perfect during the Holiday season if your students are reading about Gingerbread Men and getting ready to celebrate Christmas!The following sheets are also included:What part did you bite first? Recording SheetAnalyze Our Data SheetWha
Grades:
PreK - 2nd
Types:
Showing 1-24 of 1,159 results


