TPT
Total:
$0.00

Data and Graphing Activities for First Grade

Rated 4.84 out of 5, based on 156 reviews
4.8 (156 ratings)
;
Susan Jones
41.9k Followers
Grade Levels
K - 2nd
Standards
Formats Included
  • PDF
Pages
33 pages
$3.99
$3.99
Share this resource
Report this resource to TPT
Susan Jones
41.9k Followers

What educators are saying

I love all of the activities in this resource. I have used some in whole group math lessons and some in math stations.
My students loved this! They found the graphs easy to look at and were happy with the graphing topics.

Description

These data and graphing lessons, activities and printables have students using fun, hands on methods to analyze, collect and record data!

GET THESE ACTIVITIES AND MORE BY PURCHASING MY MATH WORKSHOP BUNDLE FOR THE WHOLE YEAR! SEE MORE HERE!

The objectives of these lessons, activities, and printables are:

Students will be able to:

- Collect data accurately.

- Organize data using different types of graphs.

- Compare and analyze data shown on different graphs.

In this unit:

Block graphs - hands on lesson and recording sheet

Data Collection - hands on lesson and recording sheet

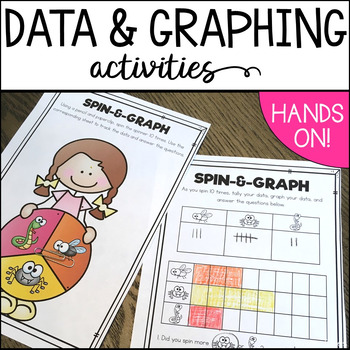
Spin-&-Graph - math center

Cups of Counters - hands on lesson and recording sheet

Class Graphs

Make a Pictograph

Data/Graphing task cards

4 Printable Practice pages

You can find this unit in a DISCOUNTED measurement bundle HERE!

Download the preview to get a closer look at what's included!

Total Pages
33 pages
Answer Key
N/A
Teaching Duration
N/A
Report this resource to TPT
Reported resources will be reviewed by our team. Report this resource to let us know if this resource violates TPT’s content guidelines.

Standards

to see state-specific standards (only available in the US).
Organize, represent, and interpret data with up to three categories; ask and answer questions about the total number of data points, how many in each category, and how many more or less are in one category than in another.
Generate measurement data by measuring lengths of several objects to the nearest whole unit, or by making repeated measurements of the same object. Show the measurements by making a line plot, where the horizontal scale is marked off in whole-number units.
Draw a picture graph and a bar graph (with single-unit scale) to represent a data set with up to four categories. Solve simple put-together, take-apart, and compare problems using information presented in a bar graph.

Reviews

Questions & Answers

41.9k Followers