TPT
Total:
$0.00

Emoji Graphs and Data Project {Charts, Pictographs, Bar Graphs}

Rated 4.89 out of 5, based on 305 reviews
4.9 (305 ratings)
;
Kim Solis
3.1k Followers
Grade Levels
2nd - 3rd, Homeschool
Resource Type
Standards
Formats Included
  • PDF
Pages
23 pages
$4.00
$4.00
Share this resource
Report this resource to TPT
Kim Solis
3.1k Followers

What educators are saying

Very engaging for my students. They loved the emojis and we used it for several different graphing lessons. I put magnets on the big emojis and left them up on my whiteboard. Very useful!
The class really enjoyed completing this activity. They had fun interacting with each other and creating graphs. Thank you!

Description

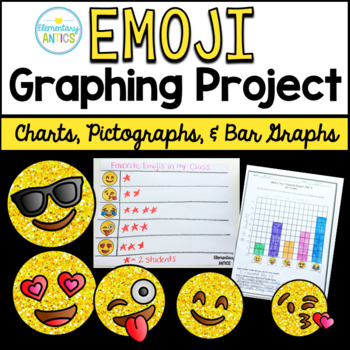
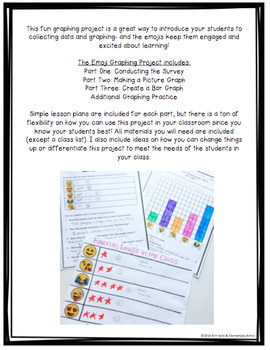
This fun graphing project is a great way to introduce your students to collecting data and graphing- and the emojis keep them engaged and excited about learning!

The Emoji Graphing Project includes 3 days of lesson plans!

Part One: Conducting the Survey

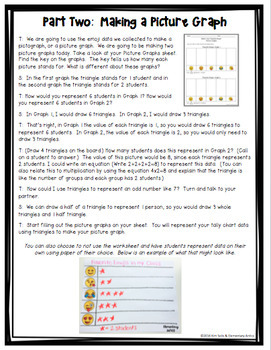
Part Two: Making a Picture Graph

Part Three: Create a Bar Graph

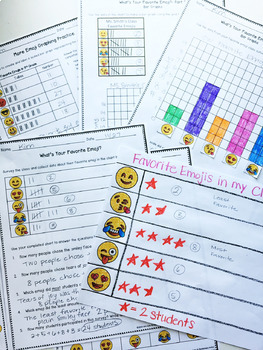
Additional Graphing Practice (3 more worksheets)

Simple lesson plans are included for each part, but there is a ton of flexibility on how you can use this project in your classroom since you know your students best! All materials you will need are included (except a class list). I also include ideas on how you can change things up or differentiate this project to meet the needs of the students in your class.

Do your students ♥ emojis?

Save some $$ and check out my Multiplication & Division Emoji Math Bundle !

If you are looking for additional graphing practice and task cards try my Graphs & Data Packs!

I really hope you enjoy my product! If you are unsatisfied in any way, contact me right away and I will do my best to make it right :)

Please follow me on TPT and Facebook to be updated as I add more products to my store :) I really appreciate your support!

Visit my blog, Elementary Antics for more fun ideas!

Feel free to email me at:

kim@elementaryantics.com

Total Pages
23 pages
Answer Key
Included
Teaching Duration
N/A
Report this resource to TPT
Reported resources will be reviewed by our team. Report this resource to let us know if this resource violates TPT’s content guidelines.

Standards

to see state-specific standards (only available in the US).
Draw a picture graph and a bar graph (with single-unit scale) to represent a data set with up to four categories. Solve simple put-together, take-apart, and compare problems using information presented in a bar graph.
Draw a scaled picture graph and a scaled bar graph to represent a data set with several categories. Solve one- and two-step “how many more” and “how many less” problems using information presented in scaled bar graphs. For example, draw a bar graph in which each square in the bar graph might represent 5 pets.

Reviews

Questions & Answers

3.1k Followers