31 results
2nd grade graphing rubrics
Student Data Tracking Binder - 2nd Grade Math - Editable
These Student Data Tracking Binders are an easy-to-implement system. Put students in charge of tracking their own learning and data! With this Student Data Tracking Binder, your students will monitor their own growth and progress using standards based assessments (also found in my store), rate and date their learning using Marzano's Levels of Thinking/Understanding, and keep track of "I can" statements or learning targets as they progress through the Common Core Standards. This resource is now e
Subjects:
Grades:
2nd
Types:
FRENCH Data Management Unit Plan - Grade 2
This Math Data Management Unit Plan was created for Grade 2 French Immersion and aligns with the Ontario Math Curriculum. It includes:Unit plan composed of 19 detailed lesson plansUnit vocabulary listWorksheetsGraphing games and fun activitiesA list of simple and higher level sentence prompts used to analyze data. Bar graph criteria mini-checklistsTemplates for every type of graphPages you may project on the whiteboard or document camera to use for a lesson.1 Mini-assessment and 1 test with corr
Grades:
2nd
Types:

Fluency Graphs (Monster Readers Theme)
Monster Readers Fluency Graphs--
Monitor your monster readers' fluency progress!
Great for record-keeping and data management!
In this packet, you will find:
* About Fluency & Tracking Progress (basic facts)
* Background Info on Timed Reading, Target Charts & Recording Sheets
* 5 Different Graphs: 60, 100, 120, 150 plus blank one to write in goal targets
* A class profile sheet
* Fluency Rubric
* Fun partner recording sheets
* 2 Award Sheets for meeting goals (one color, one b/w--half
Subjects:
Grades:
K - 4th
Types:
Also included in: Reading and Writing Super Mega Bundle Deal
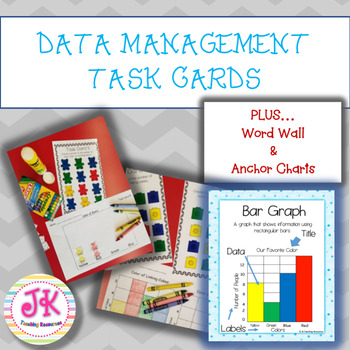
Data Management & Analysis Bundle-Pictograph | Bar Graphs | Tally Marks |
This data management bundle is loaded with over 40 pages of task cards, anchor charts, rubrics AND a word wall! All of which requires very little to NO PREP! It was designed to help teachers teach, reinforce, practice, and assess students’ understanding of the data management/analysis unit.Our focus was on Grade 2, 3 and special education classrooms when we made this product but it does align with Kindergarten and Grade 1 standards or make a good review in elementary classrooms. Especially for b
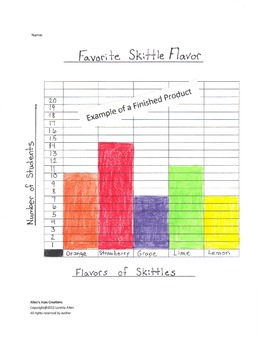
Bar Graphing - Skittles Candy
Students will taste test each Skittles Candy flavor, and then ask their classmates their favorite flavors and record the data collected. Then they use their data to create a bar graph. I use this in my 3rd grade class and it is always a big hit activity!
Subjects:
Grades:
2nd - 6th
Types:
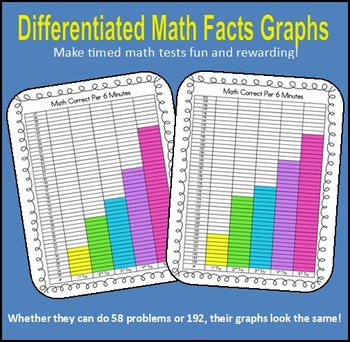
Differentiated Math Facts Graphs
These "Differentiated Math Facts Graphs" allow the kids to graph the scores of their timed math facts tests. The visual encourages students to work towards beating their own scores.
I've found that my students do not compare graphs based on the tiny numbers to the side, but rather by whose bar is tallest or who made the most growth. This allows even the struggling students to be recognized and feel great for their hard work!
Can be used with addition, subtraction, multiplication, or divisi
Subjects:
Grades:
1st - 4th
Types:
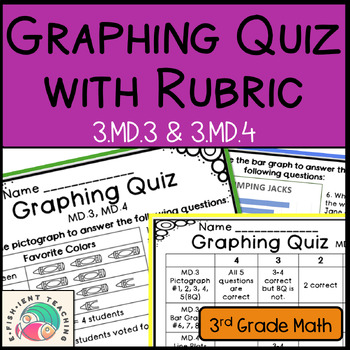
Graphing Quiz: 3rd Grade Measurement & Data: Bar Graphs, Pictographs, Line Plots
3rd grade core Graphing Quiz. Are you ready to see what your students have learned about graphs? This quiz covers bar graphs, pictographs, and line plots. Students will show their knowledge of reading graphs and interpreting what they mean. This graphing quiz comes with answer keys to make grading easy. It also comes with a standards based rubric. This rubric is on a scale of 1-4. Each question on the quiz correlates with a 3rd grade math standard making grading easy.Use this quiz to assess the
Subjects:
Grades:
2nd - 3rd
Types:
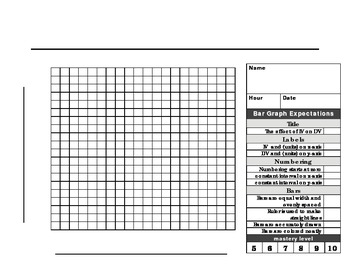
Bar Graph paper and rubric
This 20 X 20 graph paper with rubric is made for a beginner scientist to make a the perfect BAR graph. The checklist format makes it easy for students to know what is expected when graphing. Enjoy!
Subjects:
Grades:
1st - 12th, Higher Education, Adult Education
Types:
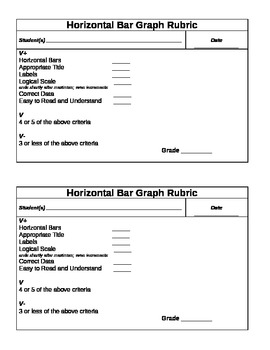
Bar Graph Rubric for Horizontal and Vertical Bars
This rubric can be used for creating bar graphs. It's title and fields can be changed to reflect both horizontal and vertical bars. Please email me at ktastinger@gmail.com if you have any issues editing the file.
Subjects:
Grades:
1st - 4th
Types:
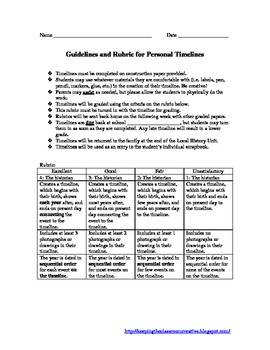
Student Timeline
This is a guide for student creation of a personal timeline. It is connected to Ohio standards in History under Historical Thinking. Timelines are to be completed on construction paper provided by the teacher.
Students may use whatever materials they are comfortable with (i.e. labels, pen, pencil, markers, glue, etc.) in the creation of their timeline. Let them be creative!
Parents may assist as needed, but please allow the students to physically do the work.
Timelines are then graded using the
Grades:
2nd - 6th
Types:
Bar Graph Rubric
Makes scoring students bar graphs easy and not subjective
Also has column for student to do a self evaluation
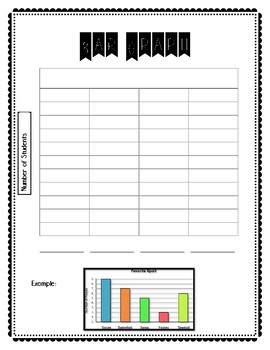
Graphing Performance Task (GOMath Unit 10)
This FUN real world based project starts by asking students to create their own survey question to help the principal learn more about his/her students. After students survey their classmates, they display the data in the form of a tally chart, pictograph, bar graph, and line graph. Students can then take it one step further and create a poster with the information they gathered.I also made this project cross curricular because after making the poster students wrote letters to the principal expl
Halloween Writing and Graphing
This is a great bundle to get for Halloween. They are great pieces to display on bulletin boards or in the hallway especially for Halloween Parties. Everything you need for writing an opinion piece is included (graphic organizers, rubric, I can poster, creative writing poster). There is also a math component. Students can sort and graph Halloween costumes. Thank you for looking and I hope you enjoy using this in your classroom as much as I did.
Subjects:
Grades:
1st - 3rd
Types:
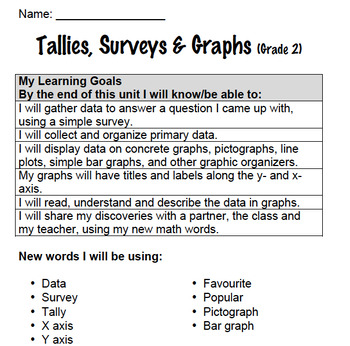
Data Management Bundle
A variety of activities, worksheets, exit tickets, and rubrics are included.
Grades:
K - 3rd
Types:
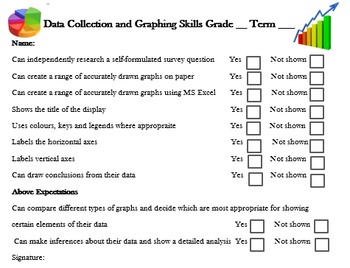
Graph and Data Assessment Checklist & Rubric
Short and quick-to-mark assessment rubric and checklist for graphing tasks suitable for students from grades 2 to 6.
You may also like:
-Comprehensive Multiplication Unit for free
- All Materials Maths units, just click on my store logo to view the full range.
Full set of Maths Assessments:
- Place Value Assessment
- Addition Assessment
- Subtraction Assessment
- Multiplication Assessment
- Division Assessment
- Fractions/Decimals Assessment
Subjects:
Grades:
2nd - 6th
Types:
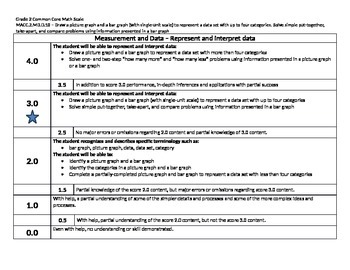
Scale Math Common Core 2nd Grade MACC.2.MD.D.10 Measurement 2MDD10 Gr 2 CCSS
This is a scale for the Common Core Standard MACC.2.MD.D.10. It's a 0-4 scale, with 3 being the proficient level of mastering the standard. Please check out my numerous other scales as well.
Subjects:
Grades:
2nd
CCSS:
Pictograph Rubric
Makes scoring students pictographs easy and not subjective
Also has column for student to do a self evaluation
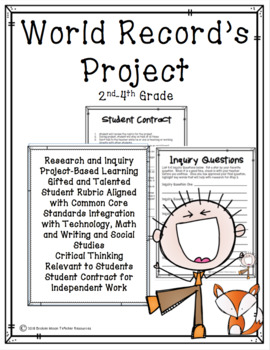
World Record's Project
Students will incorporate reading, analyzing and creating charts and graphs, researching on the internet, writing and social studies. After developing Inquiry questions about world records, students will research one of their questions. After comparing different records and websites by taking notes, students will write their own article with a graphic source from the information they researched. This project is great for higher level students who need a deeper connection to content that is re
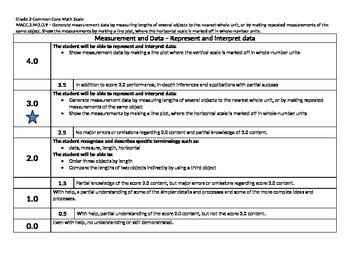
Scale Math Common Core 2nd Grade MACC.2.MD.D.9 Measurement 2MDD9 Gr 2 CCSS
This is a scale for the Common Core Standard MACC.2.MD.D.9. It's a 0-4 scale, with 3 being the proficient level of mastering the standard. Please check out my numerous other scales as well.
Subjects:
Grades:
2nd
CCSS:
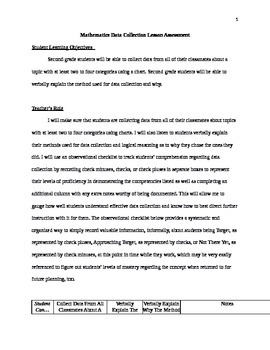
Mathematics Data Collection Lesson Assessment
This is one assessment of an observational checklist for the basic mathematics lesson regarding data collection that is most appropriate for first through fourth grade students with minimal modification needed, if any at all, but could be adjusted for many other grades. The lesson targets two principal objectives: students will be able to collect data from all of their classmates about a topic with at least two to four categories using a chart and students will be able to verbally explain the me
Subjects:
Grades:
1st - 4th
Types:
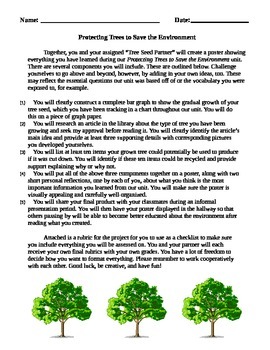
Thematic Unit Summative Assessment
This is the summative assessment for a thematic unit about the environment. There are directions and rubrics for activities in three different areas: reading, mathematics, and science. There was one main objective for each of these targeted disciplines, respectively: students will be able to effectively summarize the main idea of a text and give supporting examples to explain it, students will be able to apply a four step TAUB (Title, Axes, Unites, Bars) process to create a bar graph. The lesson
Subjects:
Grades:
2nd - 8th
3 Graphing Centers for Upper Primary
3 math graphing centers for upper primary including bar graphs, picture graphs, and data charts. Full preview given. Centers are hands-on and use pop-cubes, graph paper, and more.
Rubrics included for each center!
3 Graphing Centers for Upper Primary by Mrs. Skipworth's Secrets is licensed under a Creative Commons Attribution-NoDerivatives 4.0 International License.
Grades:
2nd - 3rd
Types:
Mathematics Data Representation Lesson Assessment
This is one assessment of a holistic rubric for the basic mathematics lesson regarding data representation that is most appropriate for first through fourth grade students with minimal modification needed, if any at all, but could be adjusted for many other grades. The lesson targets two principal objectives: students will be able to visually represent collected data from classmates about a topic with at least two to four categories in a clearly labeled graph and students will be able to explain
Subjects:
Grades:
1st - 4th
Types:
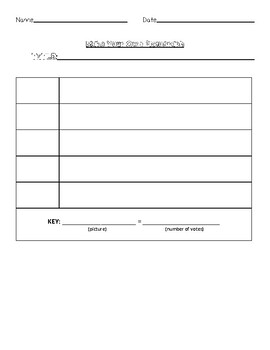
Pictograph (Graphing) Assessment Package
Create a Pictograph assessment for Grades 1-2. This package includes a data collection activity where students create their own survey and graph the results in a pictograph. Includes all templates, graph analysis questions, success criteria, and grading rubric. *Fonts are not my own*
Grades:
1st - 2nd
Types:
Showing 1-24 of 31 results


