
Scatter Plot Worksheet


The Clever Clover
2.3k Followers
Grade Levels
6th - 9th, Adult Education, Homeschool
Subjects
Resource Type
Standards
CCSS8.SP.A.1
CCSS8.SP.A.2
CCSS8.SP.A.3
CCSSHSS-ID.B.6
Formats Included
- PDF
Pages
2 + answer documents
The Clever Clover
2.3k Followers
Also included in
 This resource includes six half pages of notes that are perfect for interactive notebooks. The first three pages introduce students to positive, negative and no correlation scatter plots. Students are asked to describe real world situations that might exist for each type of correlation. Students wiPrice $4.50Original Price $5.00Save $0.50
 Are your kids studying the measures of central tendency, box and whisker plots, stem and leaf plots, two-way tables, histograms and scatter plots? This valuable resource includes guided notes, worksheets, scavenger hunts, assessments and more that you can use for your statistics unit. Below you willPrice $20.80Original Price $26.00Save $5.20
Description
Scatter Plot Worksheet
This resource allows students to explore scatterplots with a two page worksheet. Students are asked to define scatterplots in their own words. Nine questions ask students to identify the type of correlation (positive, negative or no correlation) that exists between two variables. Students are also asked to describe the steps used to write an equation for the line of best fit. Six additional questions require students to calculate the slope and determine the y-intercept in order to write the equation for the line of best fit.
The following related resources are also available for purchase.
Scatter Plot Guided Notes
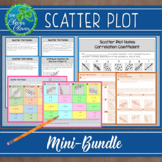
Scatter Plot Mini - Bundle
Scatter Plot Matching Activity
Leaving feedback will earn you credits for future TPT resources. Follow me to receive discounts for the first 24 hours on new resources.
Please contact me if you have any questions. The Clever Clover
Connect with me on social media!
The Clever Clover - Pinterest
The Clever Clover - Instagram
The Clever Clover - Facebook
This resource allows students to explore scatterplots with a two page worksheet. Students are asked to define scatterplots in their own words. Nine questions ask students to identify the type of correlation (positive, negative or no correlation) that exists between two variables. Students are also asked to describe the steps used to write an equation for the line of best fit. Six additional questions require students to calculate the slope and determine the y-intercept in order to write the equation for the line of best fit.
The following related resources are also available for purchase.
Scatter Plot Guided Notes
Scatter Plot Mini - Bundle
Scatter Plot Matching Activity
Leaving feedback will earn you credits for future TPT resources. Follow me to receive discounts for the first 24 hours on new resources.
Please contact me if you have any questions. The Clever Clover
Connect with me on social media!
The Clever Clover - Pinterest
The Clever Clover - Instagram
The Clever Clover - Facebook
Total Pages
2 + answer documents
Answer Key
Included
Teaching Duration
45 minutes
Report this resource to TPT
Reported resources will be reviewed by our team. Report this resource to let us know if this resource violates TPT’s content guidelines.
Standards
to see state-specific standards (only available in the US).
CCSS8.SP.A.1
Construct and interpret scatter plots for bivariate measurement data to investigate patterns of association between two quantities. Describe patterns such as clustering, outliers, positive or negative association, linear association, and nonlinear association.
CCSS8.SP.A.2
Know that straight lines are widely used to model relationships between two quantitative variables. For scatter plots that suggest a linear association, informally fit a straight line, and informally assess the model fit by judging the closeness of the data points to the line.
CCSS8.SP.A.3
Use the equation of a linear model to solve problems in the context of bivariate measurement data, interpreting the slope and intercept. For example, in a linear model for a biology experiment, interpret a slope of 1.5 cm/hr as meaning that an additional hour of sunlight each day is associated with an additional 1.5 cm in mature plant height.
CCSSHSS-ID.B.6
Represent data on two quantitative variables on a scatter plot, and describe how the variables are related.
Reviews
Questions & Answers
2.3k Followers
