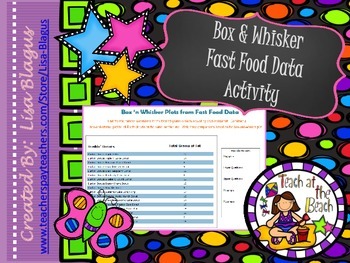
Box 'n Whisker Data for Local Fast Food Restaurants
Lisa Blagus Teach at the Beach
1.6k Followers
Grade Levels
6th - 11th, Adult Education, Homeschool
Subjects
Resource Type
Formats Included
- PDF
Pages
7 pages
Lisa Blagus Teach at the Beach
1.6k Followers
Description
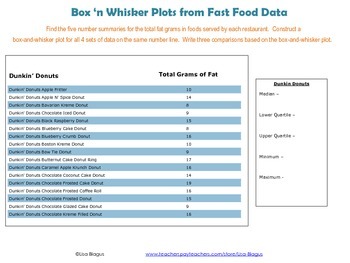
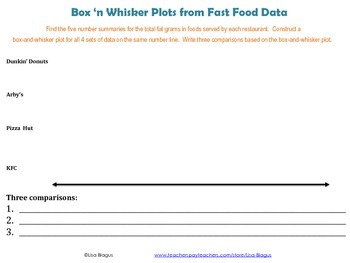
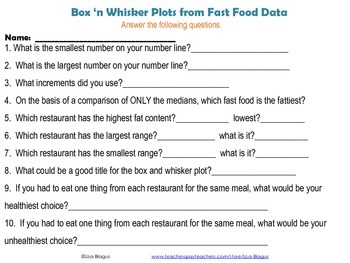
This activity brings a real-life activity into the classroom. Students look at 4 popular fast food restaurants (Arbys, KFC, Dunkin Donuts, and Pizza Hut)and find the median, maximum, minimun, lower quartile, and upper quartile from their grams of fat. After looking at each of them, students are asked to answer questions pertaining to the box and whisker graphs they've drawn from the data. A fun way to construct graphs and look at data!!!
Looking for a few more resources? This product is part of a bundle:
https://www.teacherspayteachers.com/Product/Box-and-Whisker-Plot-Activity-Bundle-with-Graph-and-Color-Activity-155039
Looking for a few more resources? This product is part of a bundle:
https://www.teacherspayteachers.com/Product/Box-and-Whisker-Plot-Activity-Bundle-with-Graph-and-Color-Activity-155039
Total Pages
7 pages
Answer Key
Included
Teaching Duration
90 minutes
Report this resource to TPT
Reported resources will be reviewed by our team. Report this resource to let us know if this resource violates TPT’s content guidelines.


