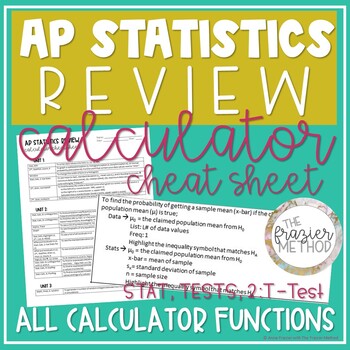
AP Statistics Review - Calculator Cheat Sheet for TI-84 Plus CE on AP Stats Exam
- PDF
What educators are saying
Description
AN ENTIRE YEAR OF STATISTICS CALCULATOR FUNCTIONS for the TI-84 PLUS CE or TI-84 PLUS!!!
Is AP Statistics hard? Not with this all-in-one AP Statistics calculator cheat sheet! Use this AP Statistics worksheet of calculator functions to help your students review for the AP Stats Exam! This AP Statistics reference sheet includes calculator functions from Units 1-7 - such as linear regression, probability formulas, graphs, re-expression, confidence intervals hypothesis tests, and more! This is a one-stop-shop for all the calculator functions in the AP Statistics curriculum. This will make a fantastic addition to your AP Statistics review material!
WHAT'S INCLUDED IN THIS PRODUCT?
AP Statistics Review: CALCULATOR CHEAT SHEET
- 3 Pages
- Calculator Functions for TI-84 Plus CE from Units 1-7 in AP Statistics
Includes how to use your calculator to...
- Graph a scatterplot, histogram, boxplot, & normal probability plot
- Generate random numbers for a simulation or sampling method
- Find the area (%) under the Normal curve given a z-score
- Find a z-score given the area (%) under the Normal curve
- Calculate mean, median, quartiles, range, and standard deviation
- Determine the correlation coefficient, equation of a linear model, & residuals
- Re-express data in a scatterplot
- Determine probability with a Geometric Distribution or Binomial Distribution
- Find the area (%) under the curve of a T-Model given a t-value
- Find a t-value given the area (%) under the curve of a T-Model
- Create a 1-Proportion Z-Interval, 2-Proportion Z-Interval, 1-Sample T-Interval, & 2-Sample T-Interval
- Perform a 1-Proportion Z-Test, 2-Proportion Z-Test, 1-Sample T-Test, & 2-Sample T-Test
- AND MORE!!!
DIFFERENT WAYS TO USE THIS PRODUCT:
*End of the year AP Statistics study guide.
*Provide this AP Statistics reference sheet for students to use while working on AP Statistics textbook problems, worksheets, or homework at home!
*Let students use as a cheat sheet on an AP Statistics practice test/exam with free response or multiple choice questions.
*Have your students use it with the AP Statistics Barron’s book or other review material.
*Pass it out at the beginning of the school year to provide your students with an AP Statistics calculator functions overview.
TERMS OF USE included for posting on online teaching sites like Blackboard or Moodle.
YOU MAY ALSO LIKE:
AP Statistics Unit 1 Notes Bundle
AP Statistics Formulas & Vocabulary for the ENTIRE YEAR
Statistics Word Wall – Graphs, Tables, Chart, & Plots Unit 1
Statistics Word Wall – Vocabulary & Formulas Unit 1
Statistics Word Wall – Vocabulary & Graphs Unit 2
SAVE MONEY ON TPT:
Earn TPT credit by reviewing products you buy! Go to "My Purchases" and click “Provide Feedback” next to each product to leave a review. These points add up and can go towards your future purchases! YAY!!!
Thank you for considering my product for purchase!


