133 results
Adult education statistics resources for Microsoft PowerPoint
6th Grade Statistics & Data 5 - Box and Whisker Plot Powerpoint Lesson
Sixth Grade Statistics 5 - Box and Whisker Plot Powerpoint Lesson is powerful when used as direct instruction in the classroom, online or individually. It teaches students all the skills necessary to make a box and whisker plot: mean, median, lower quartile Q1, upper quartile Q3, inter quartile range, range, minimum and maximum numbers. Students then are shown how to take this information and build a box and whisker plot. Finally, students are taught how to analyze the box and whisker plot th
Subjects:
Grades:
6th, Adult Education
Also included in: 6th Grade Statistics & Data Bundle - 6 Powerpoint Lessons - 402 Slides
Psychology Random Sample Population Stats M&M Worksheet for Research Methods
Psychology or Statistics Random Sample & Population Statistics M&Ms Worksheet Activity for Research Methods includes a teacher direction sheet with materials that you need and how to complete the activity along with printable handout for students. *Student Favored activity*Please email me with any questions at ReadySetLearnSocialScience@yahoo.comIf you would like to get updates on NEW and CURRENT resources...►FOLLOW Me on Teachers Pay Teachers►FOLLOW Me on Pinterest►FOLLOW Me on Instagr
Subjects:
Grades:
4th - 12th, Adult Education
Types:
6th Grade Statistics & Data 1 - Statistical Questions & Types of Data Lesson
Sixth Grade Statistics 1 - Statistical Questions and Types of Data Powerpoint Lesson is powerful when used as direct instruction in the classroom, online, or individually. It teaches students how to recognize and pose a statistical question. Students also learn the difference between numerical and categorical data. They also learn the 4 basic steps in presenting data: posing a statistical question, gathering the data, displaying the data, and answering the question they posed. There are 22
Subjects:
Grades:
6th, Adult Education
CCSS:
Also included in: 6th Grade Statistics & Data Bundle - 6 Powerpoint Lessons - 402 Slides
IB Psychology Internal Assessment (IA) Analysis and Statistics Slides
Walk your students through the Analysis section of the Internal Assessment (IA). Google slides include content and background information on statistics, directions and links for students to follow while they write their Analysis section, create their table and graph, and run descriptive statistics and inferential statistics with their raw data. Includes links to online calculators for mean, standard deviation, Mann Whitney U Test, Wilcoxon Test. Analysis rubric and links to two IA exemplars incl
Subjects:
Grades:
9th - 11th, Higher Education, Adult Education
STANDARD DEVIATION for DUMMIES POWERPOINT
I created this powerpoint for my AP Biology students in the hope that they will have a firmer grasp of what standard deviation is beyond just a formula that is on an excel spreadsheet. Their intrinsic understanding helped them create beautiful graphs from their lab "Factors affecting enzyme activity lab" that I have included at the end of the powerpoint. Please let me know if you found it useful or what is lacking and I can make it even better as I find students shy away from the statistics when
Subjects:
Grades:
10th - 12th, Higher Education, Adult Education, Staff
Types:
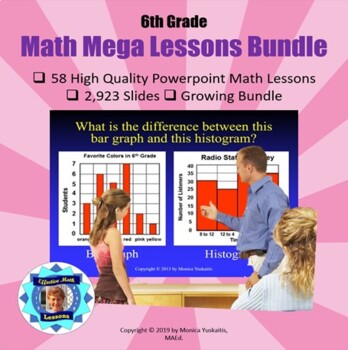
6th Grade Powerpoint Mega Math Bundle - 58 Lessons - 2923 Slides
Sixth Grade Powerpoint Math Bundle is composed of 58 different high quality math powerpoint lessons comprising 2,923 slides. These are perfect for distance learning on Zoom or similar formats. On top of that they are powerful when used as direct instruction in the classroom.There are 22 strategies of effective teaching based on research in these powerpoint lessons. . For further information on each lesson click on them individually. This is a growing bundle which means as new products are a
Subjects:
Grades:
6th, Adult Education
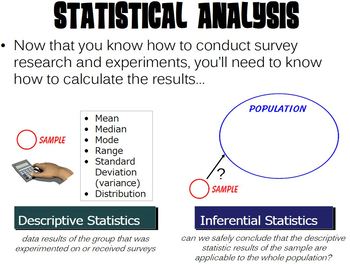
Statistical Analysis PowerPoint
Contains a PowerPoint presentation covering statistical analysis. This PP was designed to be used with a Psychology or AP Psychology course as part of a Research Methods unit, but it could also be used in a variety of math and/or statistic classes.The PowerPoint is HIGHLY animated and is designed to capture student attention. Each slide has transitions along with rich, moving media. Additionally, a guided note sheet (both an editable Microsoft Word version and a PDF version) is included in the z
Subjects:
Grades:
7th - 12th, Higher Education, Adult Education, Staff
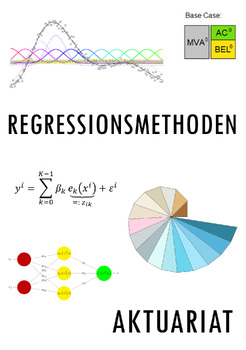
Regressionsmethoden im Aktuariat (Präsentationsfolien)
Lernziel: Überblick über verschiedene Regressionsmethoden, Machine Learning Ansätze und künstliche neuronale Netze sowie Transfer der Theorie auf eine praktische Anwendung im Risikomanagement von VersicherungsunternehmenIn diesen Präsentationsfolien werden diverse adaptive Machine Learning Ansätze ausgehend von der Methode der kleinsten Quadrate und Modellwahlkriterien zur Herleitung der Verlustfunktion (sog. "Proxyfunktion") eines Lebensversicherers in Abhängigkeit seiner Risikofaktoren (z.B.
Subjects:
Grades:
11th - 12th, Higher Education, Adult Education
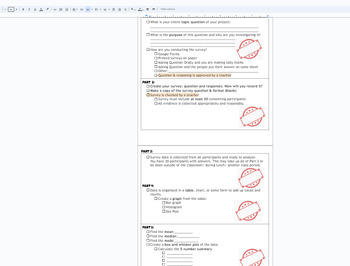
Statistics Survey project Discovery (broken down into sections) with Rubric
This is a broken down (scaffolded) packet of instructions/ guide for a Stats Project for Math 1 HS or 8th grade students. The goal of the project is for students to take a statistical survey on quantitative data (numbers) of their choice. Using this data from the survey, the following will be included in the project:Survey- the question being askedSurvey responses (requirement of 30)Data organization: Bar chart, Histogram, Dot PlotMeanMedianModeBox and Whisket Plot5 number summary (Q1,Q2,Q3, min
Subjects:
Grades:
7th - 12th, Higher Education, Adult Education
CCSS:

Statistics Module Bundle
Dear Customers!This Statistics Module Bundle file contains 18 lectures which are covered during Statistics Module.Each lecture containing:- Lecture PPT- Test Bank with answers for each lecture - Exercises for seminars/lectures with answers
Subjects:
Grades:
6th - 12th, Higher Education, Adult Education, Staff
6th Grade Statistics & Data 6 - Mean Absolute Deviation Powerpoint Lesson
Sixth Grade Statistics 6 - Mean Absolute Deviation Powerpoint Lesson is powerful when used as direct instruction in the classroom, online or individually. It teaches students the steps to take to find the Mean Absolute Deviation of a set of data. The skills necessary to do this task are reviewed: how to find the mean, how to find absolute values of numbers, and how to add and subtract integers. There are 22 effective teaching strategies based on research used in this lesson. For best resul
Subjects:
Grades:
6th, Adult Education
Also included in: 6th Grade Statistics & Data Bundle - 6 Powerpoint Lessons - 402 Slides
AP Statistics Bundle: Lecture/Worksheets - Hypothesis Testing, Confidence & More
This bundle includes the following presentation/lectures:- 22-slide presentation on Independence and Conditional Probability- 41-slide presentation on the Normal Distribution & Z-Scores- 55-slide presentation on the Student's T-Distribution- 96-slide presentation on Confidence Intervals & Hypothesis Testing- 49-slide presentation on Chi-Square Goodness of Fit TestingA Cumulative Final Exam with 36 questionsWorksheets on probability, sampling and box & whisker charts, measures of cent
Subjects:
Grades:
10th - 12th, Higher Education, Adult Education
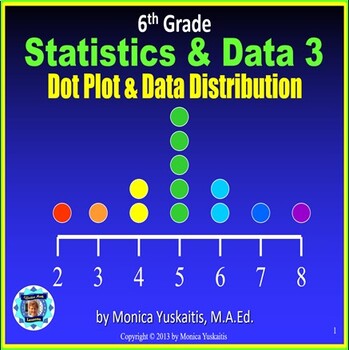
6th Grade Statistics & Data 3 - Dot Plot and Data Distribution Powerpoint Lesson
Sixth Grade Statistics 3 - Dot Plot and Data Distributions Powerpoint Lesson - is powerful when used as direct instruction in the classroom, online, or individually. It teaches students how to read and create dot plots. In addition, students learn to analyze the data as to its center, spread, and most common numbers. There are 22 strategies of effective teaching based on research. For best results, students should have white boards and dry erase markers. For instructions on how to successf
Subjects:
Grades:
6th, Adult Education
CCSS:
Also included in: 6th Grade Statistics & Data Bundle - 6 Powerpoint Lessons - 402 Slides
6th Grade Statistics & Data 4 - Histogram Powerpoint Lesson
Sixth Grade Statistics 4 - Histogram Powerpoint Lesson is powerful when used as direct instruction in the classroom, online or individually. It teaches students how to identify a histogram and how to make one. Comparisons are made between a bar graph and a histogram. Many terms are defined such as axis, scale, frequency, count, range, interval, mound, skewed left, skewed right and more. There are 22 effective teaching strategies based on research used in this lesson. For best results, stud
Subjects:
Grades:
6th, Adult Education
Types:
Also included in: 6th Grade Statistics & Data Bundle - 6 Powerpoint Lessons - 402 Slides
6th Grade Statistics & Data 2 - Mean, Median, Mode & Range Powerpoint Lesson
Sixth Grade Statistics 2 - Mean, Median, Mode and Range Powerpoint Lesson is powerful when used as direct instruction in the classroom, online, or individually. It teaches students how to find the mean, median, mode and range in a group of statistics. There are 22 effective teaching strategies based on research used in this lesson. For best results, students should have white boards and dry erase markers. For instructions on how to successfully use this powerpoint math lesson click here.
Subjects:
Grades:
6th, Adult Education
Also included in: 6th Grade Statistics & Data Bundle - 6 Powerpoint Lessons - 402 Slides
Fundamental Counting Principle and Probability Powerpoint
This 22 slide powerpoint is a great way to teach Tree Diagrams, The Fundamental Counting Principle, and Probability to your Middle Schools Students. It can be used with a smartboard to get your students active and involved or without a smartboard.
Subjects:
Grades:
6th - 8th, Adult Education

Mission Series #1: Averaging
Students are placed on a mission to help the teachers of Peace University average their semester grades. They are given five teacher gradebooks and asked to find the mean for each student. Guaranteed to make learning fun and engaging! Students feel a sense of adventure as they complete this simple lesson in the form of a quest. They show their understanding of this statistic concept while they fulfill their assignment. Answer Keys included.
Subjects:
Grades:
6th - 8th, Adult Education
Types:
CCSS:

WHO'S YOUR DADDY? Corn Genetics Unit WITH Guided Inquiry Lab
50 PAGE Mendelian Genetics Unit with a Guided Inquiry Lab using an optional Chi-Squared Statistical Test.
This can be done as a lab or can just be used as a PowerPoint presentation on Genetics and/or Meiosis.
THIS LAB IS BEST USING THE REAL EARS OF CORN BUT CAN BE DONE WITH THE PHOTOS AT THE END. CORN EARS CAN BE OBTAINED FROM BIOLOGICAL SUPPLY COMPANIES OR YOUR GARDEN. :)
This lab covers the following concepts:
1. Corn Genetics, Monohybrids and Dihybrids
2. Corn (Plant) Reproduction (Ani
Subjects:
Grades:
7th - 12th, Higher Education, Adult Education

Mission 2: Backwards Averaging
This packet asks students to go on a mission to help the monsters at Peace University know where best to spend their time studying for exams. Three monsters reveal the grades they have made in each of their four classes and ask the student to find out what is the minimum grade they would need to make on each subject's exam in order to get a 90% (an A) in all of their classes.As part of the instructions for the quest, a secret for solving these types of problems is revealed. As it is explained
Subjects:
Grades:
6th, Adult Education
Types:
CCSS:
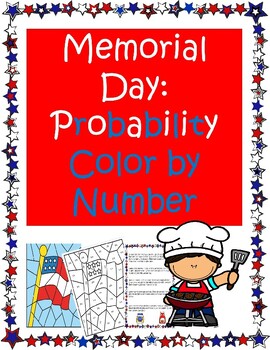
Memorial Day Probability Color by Number
In this activity, students are asked to find the probability that people at a cookout get the type of burger they want, then they are asked to find their answer on a color by number sheet. The colored picture is a flag -- great for Memorial Day and for math review in general.Product can be given for homework, independent practice or enrichment. Great for GED learners, Special Education students, and those needing an end-of-the-year review of probability.Fun exercise!No prep exercise. Answer K
Subjects:
Grades:
7th - 8th, Adult Education

Hypothesis Testing Power Point (Single Sample)
This 38-slide, editable Power Point discusses the basic steps of hypothesis testing. There are slides and examples throughout. Students will see the steps for stating a claim, writing the null and alternative hypotheses, finding the critical value (z-scores only), finding the test statistic for both means and proportions, and evaluating based on both the z-score comparison and the p-value comparison.
Subjects:
Grades:
10th - 12th, Higher Education, Adult Education
Types:
CCSS:
Also included in: Probability and Statistics PowerPoints

Confidence Intervals for Single Samples Power Point
This 26-slide, fully editable Power Point includes:vocabulary and formulas for finding the margin of error and constructing a confidence intervalexamples of confidence intervals where the population standard deviation is knownexamples of confidence intervals using the t-distributionexamples of finding confidence intervals for a population proportioncalculating the sample size necessary to obtain a given margin of error for both a mean and a proportion
Subjects:
Grades:
10th - 12th, Higher Education, Adult Education
Types:
CCSS:
Also included in: Probability and Statistics PowerPoints
AP Statistics Lessons
This set of PowerPoint presentations includes all the lessons and homework assignments I developed to teach AP Statistics. Each lesson includes lesson goals, lecture materials, bolded key definitions, activities (including links to actual, relevant AP problems by section), and homework assignments.
You could use these lessons to teach in its entirety a year-long AP Statistics course, or a college-level Statistics 101 or even a HS-level non-AP statistics course with minor tweaking. I generally d
Subjects:
Grades:
9th - 12th, Higher Education, Adult Education
CCSS:
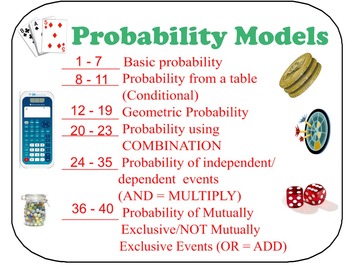
BUNDLE *** FCP, Perm, Comb, & Probability Models Lessons & Exit Ticket
BUNDLE of:
Exit Ticket on FCP, Permutation, & Combination
FCP, Permutation, and Combination - PDF 36 problems
FCP, Permutation, and Combination - Smart Notebook 36 problems
Probability Models - Power Point illustrated models
Probability Models - PDF 40 questions
Probability Models - Smart Notebook 40 questions
Visual Representation of Standard Deck of Cards
For more details, please check the individual description of those items.
Separately, these would cost more than $12.99
☺Would love
Subjects:
Grades:
6th - 12th, Higher Education, Adult Education
Showing 1-24 of 133 results


