261 results
Adult education statistics microsofts
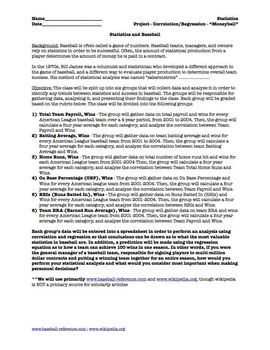
Statistics Correlation and Regression Project for Movie "Moneyball" (5 day)
Prerequisite: Correlation and Regression (Linear). This is a project that divides a statistics class into 6 groups and students do ACTUAL data collection from given websites and they perform their OWN ANALYSIS. They will use computers/internet/excel/spreadsheets/graphing calculators to evaluate correlation. If you have interest in baseball and statistics, this is a great project to get the class interested, and covers about 5 days, plus you can watch the movie "Moneyball" afterwards as a reward.
Subjects:
Grades:
10th - 12th, Higher Education, Adult Education
Types:
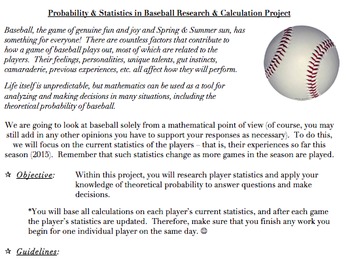
Probability & Statistics in Baseball Project (Common Core Aligned, AND FUN!)
The problems and activities within this document are designed to assist students in achieving the following standards: 6.SP.B.5, 7.SP.C, HSS.CP.A.2, HSS.CP.A.3, HSS.CP.B.7, HSS.CP.B.9, as well as the standards for mathematics practice and the literacy standards. They are also designed to help the teacher assess the students’ abilities when it comes to working with the ideas within the standards.This document contains the following:A project designed to allow students to investigate theoretical
Subjects:
Grades:
5th - 12th, Higher Education, Adult Education, Staff
Create Your Own Statistics Project
This document contains a statistics project description that allows students to create their own project. This is suitable for high school and beginning level college statistics class. Students will design their own study - formulate research questions, collect data, organize and summarize the findings, calculate confidence interval and construct hypothesis testing. Certain restrictions are outlined in the document. Students will experience the complexity of constructing their own study. They ar
Subjects:
Grades:
10th - 12th, Higher Education, Adult Education
Types:
6th Grade Statistics & Data 5 - Box and Whisker Plot Powerpoint Lesson
Sixth Grade Statistics 5 - Box and Whisker Plot Powerpoint Lesson is powerful when used as direct instruction in the classroom, online or individually. It teaches students all the skills necessary to make a box and whisker plot: mean, median, lower quartile Q1, upper quartile Q3, inter quartile range, range, minimum and maximum numbers. Students then are shown how to take this information and build a box and whisker plot. Finally, students are taught how to analyze the box and whisker plot th
Subjects:
Grades:
6th, Adult Education
Also included in: 6th Grade Statistics & Data Bundle - 6 Powerpoint Lessons - 402 Slides
Psychology Random Sample Population Stats M&M Worksheet for Research Methods
Psychology or Statistics Random Sample & Population Statistics M&Ms Worksheet Activity for Research Methods includes a teacher direction sheet with materials that you need and how to complete the activity along with printable handout for students. *Student Favored activity*Please email me with any questions at ReadySetLearnSocialScience@yahoo.comIf you would like to get updates on NEW and CURRENT resources...►FOLLOW Me on Teachers Pay Teachers►FOLLOW Me on Pinterest►FOLLOW Me on Instagr
Subjects:
Grades:
4th - 12th, Adult Education
Types:
6th Grade Statistics & Data 1 - Statistical Questions & Types of Data Lesson
Sixth Grade Statistics 1 - Statistical Questions and Types of Data Powerpoint Lesson is powerful when used as direct instruction in the classroom, online, or individually. It teaches students how to recognize and pose a statistical question. Students also learn the difference between numerical and categorical data. They also learn the 4 basic steps in presenting data: posing a statistical question, gathering the data, displaying the data, and answering the question they posed. There are 22
Subjects:
Grades:
6th, Adult Education
CCSS:
Also included in: 6th Grade Statistics & Data Bundle - 6 Powerpoint Lessons - 402 Slides

IB Psychology Internal Assessment (IA) Analysis and Statistics Slides
Walk your students through the Analysis section of the Internal Assessment (IA). Google slides include content and background information on statistics, directions and links for students to follow while they write their Analysis section, create their table and graph, and run descriptive statistics and inferential statistics with their raw data. Includes links to online calculators for mean, standard deviation, Mann Whitney U Test, Wilcoxon Test. Analysis rubric and links to two IA exemplars incl
Subjects:
Grades:
9th - 11th, Higher Education, Adult Education
STANDARD DEVIATION for DUMMIES POWERPOINT
I created this powerpoint for my AP Biology students in the hope that they will have a firmer grasp of what standard deviation is beyond just a formula that is on an excel spreadsheet. Their intrinsic understanding helped them create beautiful graphs from their lab "Factors affecting enzyme activity lab" that I have included at the end of the powerpoint. Please let me know if you found it useful or what is lacking and I can make it even better as I find students shy away from the statistics when
Subjects:
Grades:
10th - 12th, Higher Education, Adult Education, Staff
Types:
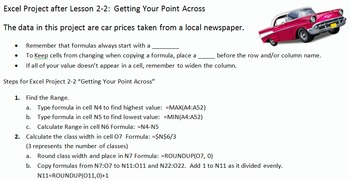
Excel Projects for Statistics Frequency Distributions and Charts
This file contains three different projects with solutions and a quick reference card for students. It correlates to Bluman's Elementary Statistics textbook.
First is an Introduction to Excel. There is an example, guided practice and then 4 Projects. The instructions are on each sheet. The topics covered are: basic editing and formatting, beginning charts, beginning formulas, such as SUM and AVERAGE, and calculations. There is an editable grading rubric for this project. The Preview file
Subjects:
Grades:
8th - 11th, Higher Education, Adult Education
Types:
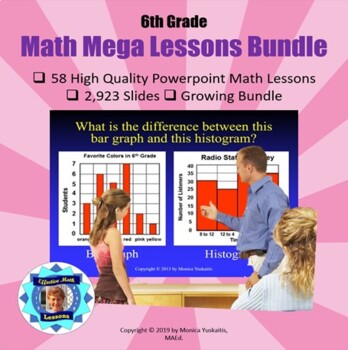
6th Grade Powerpoint Mega Math Bundle - 58 Lessons - 2923 Slides
Sixth Grade Powerpoint Math Bundle is composed of 58 different high quality math powerpoint lessons comprising 2,923 slides. These are perfect for distance learning on Zoom or similar formats. On top of that they are powerful when used as direct instruction in the classroom.There are 22 strategies of effective teaching based on research in these powerpoint lessons. . For further information on each lesson click on them individually. This is a growing bundle which means as new products are a
Subjects:
Grades:
6th, Adult Education
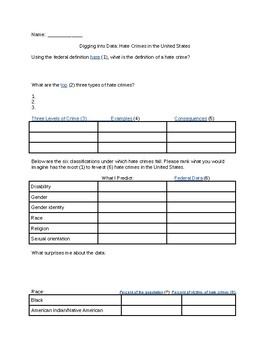
The 57 Bus- Looking at Hate Crime Data
A guided web search on hate crime data from the FBI, CDC, Pew Research Center, and U.S. Census Bureau. Uses reflection questions to make conclusions and predictions about the distribution of hate crimes. The kids are fascinated by the data!
Subjects:
Grades:
7th - 12th, Higher Education, Adult Education
Types:
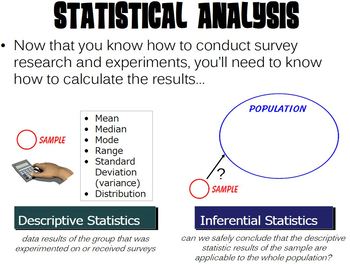
Statistical Analysis PowerPoint
Contains a PowerPoint presentation covering statistical analysis. This PP was designed to be used with a Psychology or AP Psychology course as part of a Research Methods unit, but it could also be used in a variety of math and/or statistic classes.The PowerPoint is HIGHLY animated and is designed to capture student attention. Each slide has transitions along with rich, moving media. Additionally, a guided note sheet (both an editable Microsoft Word version and a PDF version) is included in the z
Subjects:
Grades:
7th - 12th, Higher Education, Adult Education, Staff
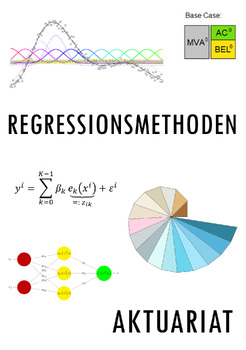
Regressionsmethoden im Aktuariat (Präsentationsfolien)
Lernziel: Überblick über verschiedene Regressionsmethoden, Machine Learning Ansätze und künstliche neuronale Netze sowie Transfer der Theorie auf eine praktische Anwendung im Risikomanagement von VersicherungsunternehmenIn diesen Präsentationsfolien werden diverse adaptive Machine Learning Ansätze ausgehend von der Methode der kleinsten Quadrate und Modellwahlkriterien zur Herleitung der Verlustfunktion (sog. "Proxyfunktion") eines Lebensversicherers in Abhängigkeit seiner Risikofaktoren (z.B.
Subjects:
Grades:
11th - 12th, Higher Education, Adult Education
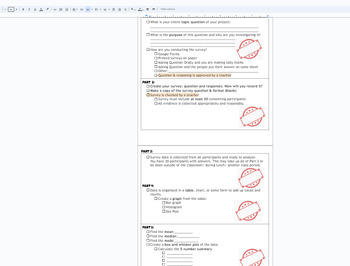
Statistics Survey project Discovery (broken down into sections) with Rubric
This is a broken down (scaffolded) packet of instructions/ guide for a Stats Project for Math 1 HS or 8th grade students. The goal of the project is for students to take a statistical survey on quantitative data (numbers) of their choice. Using this data from the survey, the following will be included in the project:Survey- the question being askedSurvey responses (requirement of 30)Data organization: Bar chart, Histogram, Dot PlotMeanMedianModeBox and Whisket Plot5 number summary (Q1,Q2,Q3, min
Subjects:
Grades:
7th - 12th, Higher Education, Adult Education
CCSS:

Statistics Module Bundle
Dear Customers!This Statistics Module Bundle file contains 18 lectures which are covered during Statistics Module.Each lecture containing:- Lecture PPT- Test Bank with answers for each lecture - Exercises for seminars/lectures with answers
Subjects:
Grades:
6th - 12th, Higher Education, Adult Education, Staff
6th Grade Statistics & Data 6 - Mean Absolute Deviation Powerpoint Lesson
Sixth Grade Statistics 6 - Mean Absolute Deviation Powerpoint Lesson is powerful when used as direct instruction in the classroom, online or individually. It teaches students the steps to take to find the Mean Absolute Deviation of a set of data. The skills necessary to do this task are reviewed: how to find the mean, how to find absolute values of numbers, and how to add and subtract integers. There are 22 effective teaching strategies based on research used in this lesson. For best resul
Subjects:
Grades:
6th, Adult Education
Also included in: 6th Grade Statistics & Data Bundle - 6 Powerpoint Lessons - 402 Slides
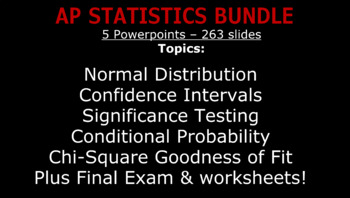
AP Statistics Bundle: Lecture/Worksheets - Hypothesis Testing, Confidence & More
This bundle includes the following presentation/lectures:- 22-slide presentation on Independence and Conditional Probability- 41-slide presentation on the Normal Distribution & Z-Scores- 55-slide presentation on the Student's T-Distribution- 96-slide presentation on Confidence Intervals & Hypothesis Testing- 49-slide presentation on Chi-Square Goodness of Fit TestingA Cumulative Final Exam with 36 questionsWorksheets on probability, sampling and box & whisker charts, measures of cent
Subjects:
Grades:
10th - 12th, Higher Education, Adult Education
Permutations and Factorial Notation Worksheet (17 Questions)
Permutations and Factorial Notation Worksheet17 Questions with the solutions1 page for the questions1 page for the answers* AlSO AVAILABLE FOR YOU OR A COLLEAGUE! - CLICK ANY LINK YOU WANT:Probability & OddsMean, median, mode, range, line plot, and Box and whisker WorksheetStatistical Math (GED REVIEW)The Binomial Theorem Worksheet (10Q)Theoretical Probability WorksheetProbability Word Problems (Worksheet) You may also be interested in my other top-selling products: EQUIVALENT FRACTIONS (33
Subjects:
Grades:
9th - 12th, Higher Education, Adult Education, Staff
Types:
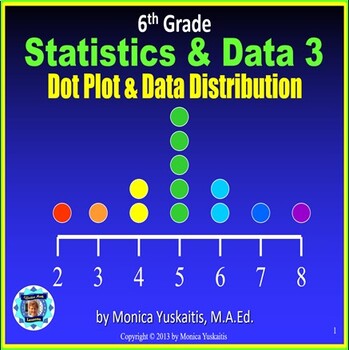
6th Grade Statistics & Data 3 - Dot Plot and Data Distribution Powerpoint Lesson
Sixth Grade Statistics 3 - Dot Plot and Data Distributions Powerpoint Lesson - is powerful when used as direct instruction in the classroom, online, or individually. It teaches students how to read and create dot plots. In addition, students learn to analyze the data as to its center, spread, and most common numbers. There are 22 strategies of effective teaching based on research. For best results, students should have white boards and dry erase markers. For instructions on how to successf
Subjects:
Grades:
6th, Adult Education
CCSS:
Also included in: 6th Grade Statistics & Data Bundle - 6 Powerpoint Lessons - 402 Slides
6th Grade Statistics & Data 4 - Histogram Powerpoint Lesson
Sixth Grade Statistics 4 - Histogram Powerpoint Lesson is powerful when used as direct instruction in the classroom, online or individually. It teaches students how to identify a histogram and how to make one. Comparisons are made between a bar graph and a histogram. Many terms are defined such as axis, scale, frequency, count, range, interval, mound, skewed left, skewed right and more. There are 22 effective teaching strategies based on research used in this lesson. For best results, stud
Subjects:
Grades:
6th, Adult Education
Types:
Also included in: 6th Grade Statistics & Data Bundle - 6 Powerpoint Lessons - 402 Slides
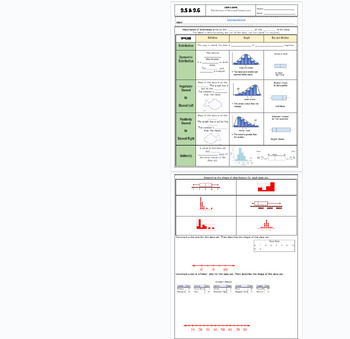
Data Distribution positive/negative skewed fillable notes UPDATED
Unit 9: Data and Stats: Updated(No 9.3/ Skip)9.5/9.6 Data Distribution (skewness)Students go over the vocabulary and complete the examples with the vocabulary scaffolded. Skewness is explained and how to identify it comparing data charts and box and whisker plots. Uses many visuals and examples to differentiate between that different graphs. Notes are scaffolded. Includes hook video hyperlinked on the "learning objective" title. Key is included and hyperlinked as a PDF in the heading highlighted
Subjects:
Grades:
6th - 12th, Higher Education, Adult Education
CCSS:
Also included in: Unit 9: Data and Statistics Fillable Notes
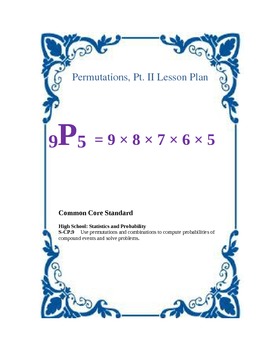
Permutations and Factorials Lesson Plans
Included on one file are two separate lesson plans. A description of each lesson follows:
Factorials & Permutations
This is a complete lesson plan that introduces factorials and "simple" permutations. Students will evaluate factorial expressions and determine the number of permutations from a number of objects.
Permutations, Pt. II
This is a complete lesson that includes more practice with permutations along with more problem solving activities.
Each lesson plan includes a warm-up activit
Subjects:
Grades:
8th - 10th, Adult Education
Types:
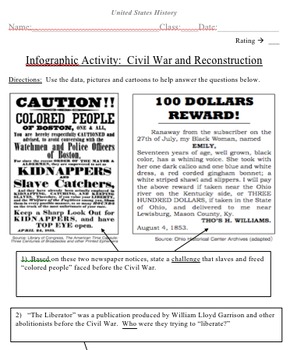
U.S. History Infographic Activity
Looking for something to help teach students how to comprehend and analyze graphs, timelines, political cartoons, posters, art and much more from U.S history? It's all here!
The content focus is on United States history and includes topics like the Civil War, Reconstruction, Women's Issues, The Roaring '20s, the Great Depression and the New Deal, the Progressive Era and the Great Society. It's all on one document, but you could easily print them off as separate, stand alone activities if yo
Subjects:
Grades:
6th - 12th, Adult Education
Types:
6th Grade Statistics & Data 2 - Mean, Median, Mode & Range Powerpoint Lesson
Sixth Grade Statistics 2 - Mean, Median, Mode and Range Powerpoint Lesson is powerful when used as direct instruction in the classroom, online, or individually. It teaches students how to find the mean, median, mode and range in a group of statistics. There are 22 effective teaching strategies based on research used in this lesson. For best results, students should have white boards and dry erase markers. For instructions on how to successfully use this powerpoint math lesson click here.
Subjects:
Grades:
6th, Adult Education
Also included in: 6th Grade Statistics & Data Bundle - 6 Powerpoint Lessons - 402 Slides
Showing 1-24 of 261 results


