340 results
Higher education statistics resources for Microsoft PowerPoint
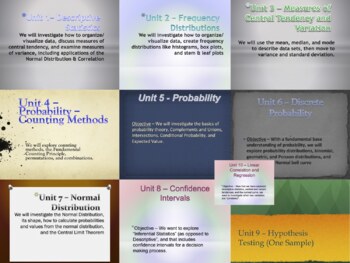
A Mountain of Statistics Curriculum - One Full Year Bundle
This is a bundle of 10 Units, Midterm Exam, & Final Exam designed for a high school Statistics Class (can be applied to University discipline). Each unit plan includes Common Core Standards, Key Concepts/Enduring Understandings, Essential Questions/Do Now, Activities, Resources, Procedures, and Assessment techniques. It is designed to be a lifelong tool that you can add to, edit, and re-use every year! Please see each Unit Statistics Product in the MountainWorks Store (sold separately) for
Subjects:
Grades:
9th - 12th, Higher Education
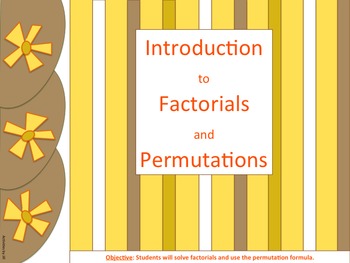
Introduction to Factorials and Permutations Presentation, Notes & Practice
Focus of Lesson: Calculate factorials and use the permutation formula.
Lesson: Use the PowerPoint presentation with layered animation accompanied by a whole class discussion.
Alternate Lesson: Does your school have one-to-one computing? Have students view the presentation on their own device. This option allows students to proceed at their own pace and ask the teacher for clarification as needed.
Presentation: Slides 1-3
Student Note-taking Outline: Slides 4-5
20 Practice Problems: Slides
Subjects:
Grades:
8th - 12th, Higher Education
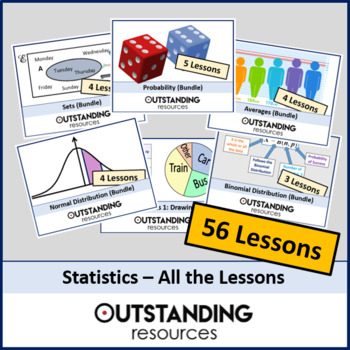
Statistics ALL LESSONS
This is 56 whole lessons with ALL additional resources included! Below is a list (alphabetical) of precisely what lessons are included. If you want more information then all individual lessons are available in my shop and maybe it might be worth buying one or two before purchasing this fantastic bundle. 1. Averages 1 - Mode, Median and Mean2. Averages 2 - comparing the different averages3. Averages 3 - Grouped Data (Estimated Mean) 4. Averages 4 - Mean vs Estimated Mean5. Bar Charts and Compara
Subjects:
Grades:
6th - 12th, Higher Education

IB Psychology Internal Assessment (IA) Analysis and Statistics Slides
Walk your students through the Analysis section of the Internal Assessment (IA). Google slides include content and background information on statistics, directions and links for students to follow while they write their Analysis section, create their table and graph, and run descriptive statistics and inferential statistics with their raw data. Includes links to online calculators for mean, standard deviation, Mann Whitney U Test, Wilcoxon Test. Analysis rubric and links to two IA exemplars incl
Subjects:
Grades:
9th - 11th, Higher Education, Adult Education
Probability and Statistics PowerPoints
This is an expanding bundle of PowerPoints created for an Intro Prob & Stats class. As I continue to modify and upload PowerPoints, I will continue to add them to this bundle.Basics of Statistics (17 slides) - this Power Point includes some of the basic vocabulary of statistics, including the concept of population and sample, distinguishing between parameters and statistics, descriptive and inferential statistics, types of data and the levels of measurement for data, the design of a statist
Subjects:
Grades:
10th - 12th, Higher Education
Types:
Statistics Unit 6 Bundle - Discrete Probability (12 days)
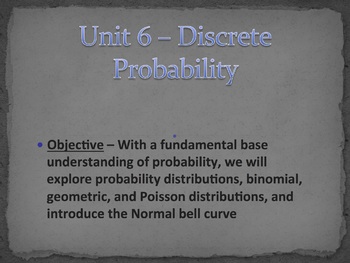
This is a unit plan bundle for a Statistics class. The plans include common core math standards, time frame, activities, enduring understandings, essential questions, and resources used. It is designed to last 12 days, depending on pacing. The plans include: 39-slide presentation, with annotated guide for reference3 Worksheets"Do Now" Entrance problems2 quizzesSpreadsheet Activity - Binomial, Geometric, Poisson DisributionsReview slides (for student-group communicators)Unit test (with review pac
Subjects:
Grades:
9th - 12th, Higher Education
CCSS:
STANDARD DEVIATION for DUMMIES POWERPOINT
I created this powerpoint for my AP Biology students in the hope that they will have a firmer grasp of what standard deviation is beyond just a formula that is on an excel spreadsheet. Their intrinsic understanding helped them create beautiful graphs from their lab "Factors affecting enzyme activity lab" that I have included at the end of the powerpoint. Please let me know if you found it useful or what is lacking and I can make it even better as I find students shy away from the statistics when
Subjects:
Grades:
10th - 12th, Higher Education, Adult Education, Staff
Types:
Statistical Analysis PowerPoint
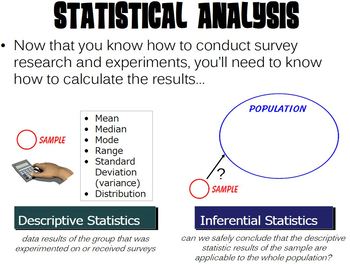
Contains a PowerPoint presentation covering statistical analysis. This PP was designed to be used with a Psychology or AP Psychology course as part of a Research Methods unit, but it could also be used in a variety of math and/or statistic classes.The PowerPoint is HIGHLY animated and is designed to capture student attention. Each slide has transitions along with rich, moving media. Additionally, a guided note sheet (both an editable Microsoft Word version and a PDF version) is included in the z
Subjects:
Grades:
7th - 12th, Higher Education, Adult Education, Staff
Benfordsches Gesetz (Präsentationsfolien + R Code)
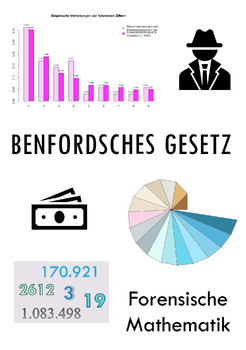
Lernziel: Umgang mit dem Benfordschen Gesetz und Einblick in die "Forensische Mathematik", Transfer der Theorie auf praktische Anwendungen in der Wirtschaftskriminalität, Programmierung in statistischer Software RDas Benfordsche Gesetz zeigt, wie Forensische Mathematik dazu beitragen kann, Betrug aufzudecken. Es ist ein wichtiges Instrument, um z.B. Wirtschaftskriminalität oder auch andere Fälle von Datenfälschungen aufzuspüren. Das Benfordsche Gesetz verblüfft, ist anwendungsbezogen und eignet
Subjects:
Grades:
11th - 12th, Higher Education
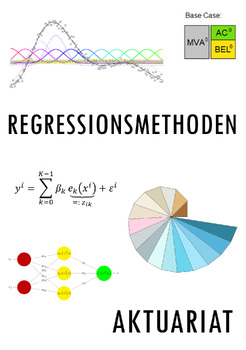
Regressionsmethoden im Aktuariat (Präsentationsfolien)
Lernziel: Überblick über verschiedene Regressionsmethoden, Machine Learning Ansätze und künstliche neuronale Netze sowie Transfer der Theorie auf eine praktische Anwendung im Risikomanagement von VersicherungsunternehmenIn diesen Präsentationsfolien werden diverse adaptive Machine Learning Ansätze ausgehend von der Methode der kleinsten Quadrate und Modellwahlkriterien zur Herleitung der Verlustfunktion (sog. "Proxyfunktion") eines Lebensversicherers in Abhängigkeit seiner Risikofaktoren (z.B.
Subjects:
Grades:
11th - 12th, Higher Education, Adult Education
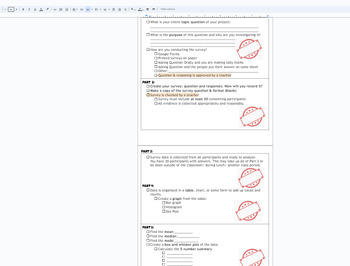
Statistics Survey project Discovery (broken down into sections) with Rubric
This is a broken down (scaffolded) packet of instructions/ guide for a Stats Project for Math 1 HS or 8th grade students. The goal of the project is for students to take a statistical survey on quantitative data (numbers) of their choice. Using this data from the survey, the following will be included in the project:Survey- the question being askedSurvey responses (requirement of 30)Data organization: Bar chart, Histogram, Dot PlotMeanMedianModeBox and Whisket Plot5 number summary (Q1,Q2,Q3, min
Subjects:
Grades:
7th - 12th, Higher Education, Adult Education
CCSS:
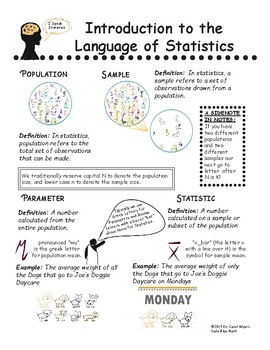
Introduction to the Language of Statistics - SketchNotes and Lecture Slides
This is a guided lecture that covers the basic vocabulary of Statistics, including Population, Statistic, Types of Data, Types of Sampling and Types of Studies. The lecture notes use simple pictures, icons and examples to help students visualize the language. The lesson includes: Teacher Notes4-pages of SketchNotes completely filled in4-pages of SketchNotes with blanks for students to fill inA 10 question (1 page) Knowledge Check for formative assessmentThe answer key for the Knowledge CheckA
Subjects:
Grades:
10th - 12th, Higher Education
CCSS:

Statistics Module Bundle
Dear Customers!This Statistics Module Bundle file contains 18 lectures which are covered during Statistics Module.Each lecture containing:- Lecture PPT- Test Bank with answers for each lecture - Exercises for seminars/lectures with answers
Subjects:
Grades:
6th - 12th, Higher Education, Adult Education, Staff
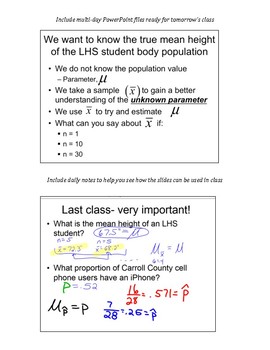
AP Statistics Stats Sampling Distributions Central Limit Theorem CLT tests keys
This is a large unit covering all things with sampling distributions. This includes three multi day powerpoint files, many handouts, two quizzes, a test (and answer keys).
The answer keys for handouts, tests and quizzes are included. I've also included my daily class notes so you can see how the powerpoint files can be used in class.
Subjects:
Grades:
10th - 12th, Higher Education
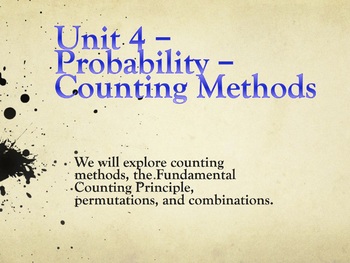
Statistics Unit 4 Bundle - Probability Counting Methods Curriculum (10 days)
Statistics Unit 4 Bundle - Probability Counting Methods Curriculum (10 days)
This is a unit plan bundle for a Statistics class. The plans include common core math standards, time frame, activities, enduring understandings, essential questions, and resources used. It is designed to last two weeks. The plans include:
35-slide presentation, with annotated guide for reference
4 Worksheets
"Do Now" Entrance problems
2 quizzes
Graphing Calculator Activity/Walkthough
Review slides (for response syst
Subjects:
Grades:
9th - 12th, Higher Education
CCSS:

Probability Bundle - PowerPoint, HW, Quizzes with Answer Keys
This bundle contains all the probability work I have posted from my Probability & Statistics course, including the answer keys that go along with it.
Subjects:
Grades:
10th - 12th, Higher Education
CCSS:
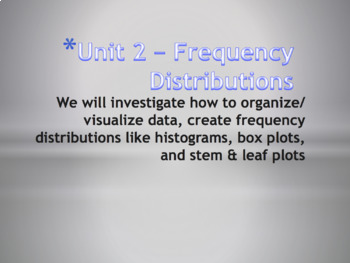
Statistics Unit 2 Bundle - Frequency Distributions Curriculum (6 days)
This is a unit plan bundle for a Statistics class. The plans include common core math standards, time frame, activities, enduring understandings, essential questions, and resources used. It is designed to last 6 days. The plans include: 21-slide presentation, with annotated guide for reference2 Worksheets"Do Now" Entrance problemsSpreadsheet Activity - "Spreadsheets and Heartbeats"Unit ReviewUnit TestGraphing Calculator instructions included on slidesPacing guide with administrative unit planAll
Subjects:
Grades:
9th - 12th, Higher Education
CCSS:
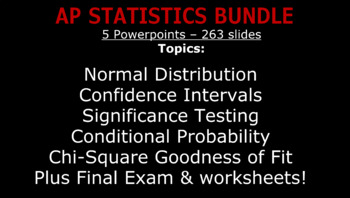
AP Statistics Bundle: Lecture/Worksheets - Hypothesis Testing, Confidence & More
This bundle includes the following presentation/lectures:- 22-slide presentation on Independence and Conditional Probability- 41-slide presentation on the Normal Distribution & Z-Scores- 55-slide presentation on the Student's T-Distribution- 96-slide presentation on Confidence Intervals & Hypothesis Testing- 49-slide presentation on Chi-Square Goodness of Fit TestingA Cumulative Final Exam with 36 questionsWorksheets on probability, sampling and box & whisker charts, measures of cent
Subjects:
Grades:
10th - 12th, Higher Education, Adult Education

Probability Bundle - PowerPoint, HW, Quizzes
This bundle contains all the probability work I have posted from my Probability & Statistics course.
Subjects:
Grades:
10th - 12th, Higher Education
CCSS:
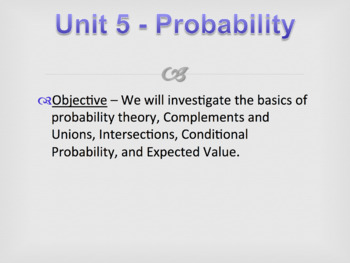
Statistics Unit 5 Bundle - Probability Curriculum (15 days)
This is a unit plan bundle for a Statistics class. The plans include common core math standards, time frame, activities, enduring understandings, essential questions, and resources used. It is designed to last 15 days, depending on pacing. The plans include: 56-slide presentation, with annotated guide for reference7 Worksheets"Do Now" Entrance problems4 quizzesLaw of Large Numbers Activity Worksheet (Drawing Hearts)Review slides (for student-group presentations, review handout included)Unit test
Subjects:
Grades:
9th - 12th, Higher Education
CCSS:

MEANS AND VARIANCES OF A RANDOM VARIABLE
Means and Variances of a Random VariableIn this lesson, students will learn:▪ how to apply the rules for sums or differences of means of two separate distributions or repeated trials from a single distribution▪ how to apply the rules for sums or differences of variances of two separate distributions or repeated trials from a single distribution
Subjects:
Grades:
10th - 12th, Higher Education
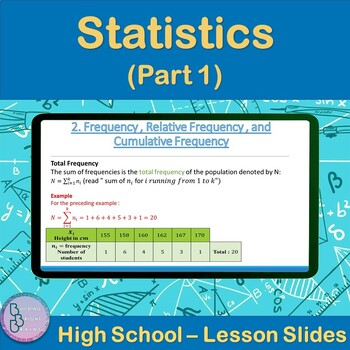
Statistics Part 1 | High School Math PowerPoint Lesson Slides
Are you teaching your High School students about Statistics? Plenty of examples and application exercises are included. You can also easily convert this to a Google Slides lesson by dragging it into your Google Drive.What is included?✦ 30 total slides for notes, examples and applications.✦ All steps are animated to allow the teacher to explain them gradually. Throughout the Lesson, students will be introduced to the following:✦ Statistics Vocabulary✦ Frequency , Relative Frequency , and Cumulati
Subjects:
Grades:
10th - 12th, Higher Education
Mathematics primer
This chapter outlines the essential mathematical building blocks you will need to work on in this course. Most of them will be revised, but some material may be new. Particular aims are to: be familiar with the basic rules of arithmetic operations learn further notation concerned with absolute value, ‘greater than’ (>) and ‘less than’ (<) signs Use summation signs to calculate simple statistical measures learn how to plot a straight-line graph and identify its slope and intercept.
Subjects:
Grades:
Higher Education

KEY | MEANS AND VARIANCES OF A RANDOM SAMPLE
Means and Variances of a Random VariableIn this lesson, students will learn:▪ how to apply the rules for sums or differences of means of two separate distributions or repeated trials from a single distribution▪ how to apply the rules for sums or differences of variances of two separate distributions or repeated trials from a single distribution
Subjects:
Grades:
10th - 12th, Higher Education
Showing 1-24 of 340 results


