10 results
Adult education statistics resources for Easel

Interpreting Graphs for the Middle & Junior High School: Book 2
Here is another set of data graphics for your students to analyze and interpret. Using survey results from the USA Today newspaper, students will be asked to explain what the graphics are illustrating. Each activity will ask the student to identify basic information presented in each graphic and make some projections based on the data given in the survey.
The activities in this packet are a great way to improve your student’s skills in taking apart graphic displays of information. Brin
Subjects:
Grades:
4th - 10th, Adult Education
Types:
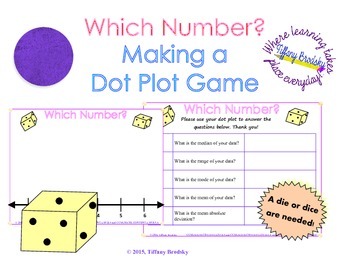
Dot Plot Graphing and Worksheet Activity (or Game)
A fantastic activity for practice after teaching mean, median, range, and mean absolute deviation. Students roll a die and plot their own graphs. Wonderful! What's Included:PDF for easy printing (color and black and white copy; you choose the best for printing)activity formatted for Easel (this is a pen activity)(You will need one die per person or group. This is not included.)This is an activity which you can simply print and set in a math center or give as an assignment. This game or activ
Subjects:
Grades:
5th - 7th, Adult Education
Types:
Easy Statistics: Calculating Variance and Standard Deviation
Statistics has always been a different subject. Some people do not like it because math is involved. Some people do not like it because it is not traditional math like algebra. It has been my experience that statistics is easier by creating step-by-step instructions. And that is how this publication has been designed. In this publication I provide steps to calculating both the population standard deviation and the sample standard deviation. Although most calculators (and spreadsheets) have a fu
Subjects:
Grades:
10th - 12th, Higher Education, Adult Education
Types:
Easy Analytics: Basic Forecasting
Forecasting is a term that carries some baggage with it. When the term is used, many people often think of weather forecasting and how right or wrong it can be. Forecasting can also be used to predict anything that can be measured. There are sales forecasts, interest rate forecasts, and population forecasts to name a few. With that being said, forecasts are never perfect. We do not have crystal balls or oracles that can tell us exactly what will happen. However, usually we do not need perfect; w
Subjects:
Grades:
10th - 12th, Higher Education, Adult Education
Types:
Also included in: Easy Analytics: Basic Forecasting Bundle
Statistics, Technology, and Analyzing Data: A descriptive look.
Save money on this bundled statistical analysis product instead of purchasing the activities individually. The activities in this product will improve your student’s skills in analyzing data. Generating stem and leaf diagrams, creating frequency tables that generate histograms, and determining basic descriptive analysis such as mean, median, range, and 5 number summaries will instill confidence. The student will also be asked to determine if “outliers” exist within the data and how they aff
Subjects:
Grades:
5th - 10th, Adult Education
Types:
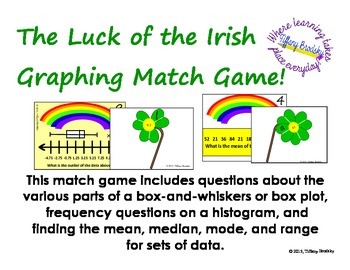
St. Patricks Day Luck of the Irish Graphing Match Game: mean, box plot, etc.
This St. Patrick's Day match game includes questions about the various parts of a box-and-whiskers or box plot, frequency questions on a histogram*, and finding the mean, median, mode, and range for sets of data. An answer key is included so you or students can check their answers thereafter. (A simple worksheet is included to have students write their answers on if you would like them to.)May you and your students enjoy!* This is about a biology test with very unusually high point values.
Subjects:
Grades:
5th - 7th, Adult Education
CCSS:

Math Project Scatter Plots: Are You Really Going to Eat That? *DISTANCE LEARNING
PRINT and DIGITAL * * Makes distance planning so much easier!Math Project Scatter Plots: Are You Really Going to Eat That? This math project is a fun way for your students to use bivariate data that is highly engaging and relevant to them to construct scatter plots in a real-world situation! Your students will enjoy making choices about restaurants and meals they like to eat based on their personal needs and wishes. Students will organize the nutrition data of the meals they choose using tables
Subjects:
Grades:
7th - 10th, Adult Education
CCSS:

Distance Learning Math Activity You and Your Smart Phone Data
Create a Math Selfie and Use Percentages to uncover your data usage on our Smart Phone!Have the students create their picture and send it to you via email. Create a collage on your computer and send it back to them to create a sense of togetherness during social distancing.
Subjects:
Grades:
6th - 12th, Higher Education, Adult Education
Types:

Census Demographic Data Internet Activity and Activity
Students collect, analyze and investigate Demographic Census Data in a compounding assignment mad for online activities or project based presentations.. Students will find resources and information from online examples to demonstrate their understanding and analysis about topics and issues on political demography. Independent or group based activity made for online or in person completion of activity. Self guided instructions with links and resources included for students to use as necessary to
Grades:
9th - 12th, Higher Education, Adult Education
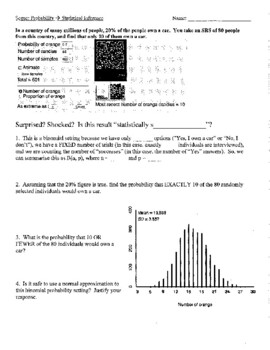
Statistics Segue: Binomial Probability to Statistical Significance
Using the binomial distribution as a backdrop, this activity segues to the concept of statistical significance. Answer KEY included.
Subjects:
Grades:
9th - 12th, Adult Education
Types:
Showing 1-10 of 10 results


