6th Grade Powerpoint Mega Math Bundle - 58 Lessons - 2923 Slides
- Zip
- Easel Assessment
Products in this Bundle (58)
showing 1-5 of 58 products
Bonus
Description
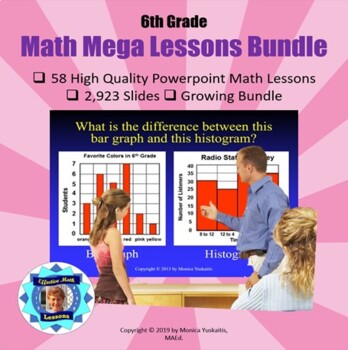
Sixth Grade Powerpoint Math Bundle is composed of 58 different high quality math powerpoint lessons comprising 2,923 slides. These are perfect for distance learning on Zoom or similar formats. On top of that they are powerful when used as direct instruction in the classroom.There are 22 strategies of effective teaching based on research in these powerpoint lessons. . For further information on each lesson click on them individually. This is a growing bundle which means as new products are added you get them for free. The price will go up for new buyers but not for you. You just have to download the bundle again. For best results, students should have white boards and dry erase markers. For instructions on how to best use this lesson click here. Here are the lessons that are covered:
- Algebra 1 - Algebraic Expressions, Variables, & Evaluating
- Algebra 2 - Using Properties to Generate Equal Expressions
- Algebra 3 - Solving Equations w Addition & Subtraction
- Algebra 4 - Solving Equations w Multiplication & Division
- Algebra 5 - Writing Inequalities
- Coordinate Plane
- Decimals 1 – Introduction and Place value
- Decimals 2 – Addition and Subtraction of Decimals
- Decimals 3 - Multiplying Decimals,
- Decimals 4 - Dividing Decimals by Whole Numbers
- Decimals 5 - Decimals Dividing Decimals
- Divisibility
- Division 1 – Long and Short Division with Remainder
- Division 2 – Dividing with Zeros in the Quotient
- Division 3 – Dividing 4 Digits by 2 Digits
- Division 4 – Strategy for Difficult Division
- Division 5 - Dividing by 3 Digits
- Division 6 – Remainders & Determining the Quotient
- Exponents
- Fractions & Decimals
- Fractions 1 - Greatest Common Factor and Simplifying,
- Fractions 2 - Least Common Multiple and Least Common Denominator,
- Fractions 3 - Addition and Subtraction of Unlike Denominators,
- Fractions 4 - Addition and Subtraction of Mixed Numbers,
- Fractions 5 - Multiplying Fractions,
- Fractions 6 - Division of Fractions and the Reciprocal,
- Fractions 7 - Division of Mixed Numbers
- Geometry 1 - Area of Triangles,
- Geometry 2 - Area of Rectangles and Squares,
- Geometry 3 - Area of Parallelograms, Rhombuses and Trapezoids,
- Geometry 4 - Using Equations to Solve Area Problems,
- Geometry 5 - Volume,
- Geometry 6 - Polygons in the Coordinate Plane,
- Geometry 7 - 3D Figures (Solids) and Their Nets,
- Geometry 8 - Surface Area.
- Graphing Equations
- Integers 1 - Introduction to Integers
- Integers 2 - Comparing & Ordering Integers
- Integers 3 - Addition of Integers
- Integers 4 - Subtracting Integers
- Integers 5 - Multiplying and Dividing Integers
- Order of Operations
- Percents 1 - Percents, Decimals and Fractions,
- Percents 2 - Finding the Percent of a Number,
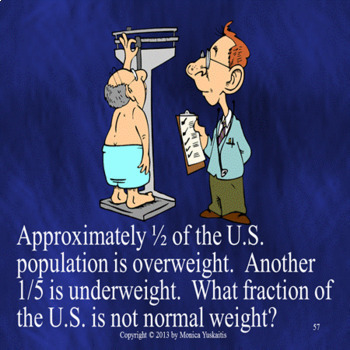
- Percents 3 - Finding What Percent One Number is of Another,
- Percents 4 - Finding a Number When a Percent of it is Known.
- Prime Factorization
- Probability 1 - Introduction & Simple Event
- Probability 2 - Compound Event
- Ratios 1 - Introduction to Ratios,
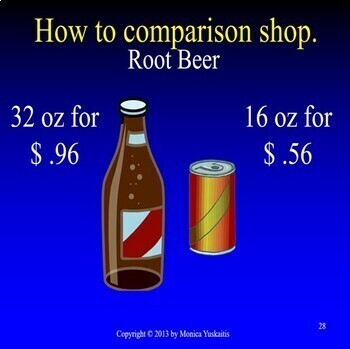
- Ratios 2 - Rates and Unit Rates
- Ratios 3 - Finding Ratios,
- Ratios 4 - Plotting ratios on the coordinate plane,
- Ratios 5 - Solving Proportion Problems.
- Statistics and Data 1 - Statistical Questions and Types of Data,
- Statistics and Data 2 - Mean, Median, Mode & Range,
- Statistics and Data 3 - Dot Plot and Data Distribution,
- Statistics and Data 4 - Histogram,
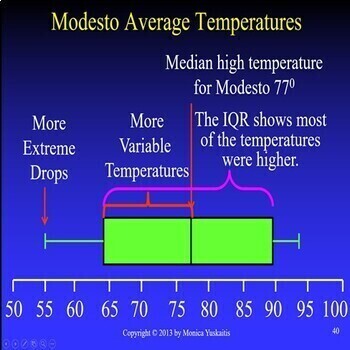
- Statistics and Data 5 - Box and Whisker Plot,
- Statistics and Data 6 - Mean Absolute Deviation.
Each lesson is well organized with the following:
- title slide
- focus slide
- objectives
- essential question
- vocabulary
- concept development
- step-by-step demonstrations on how to do the math
- guided practice
- checking for understanding
- problem solving with word problem
- reward slide
Don't forget to leave feedback on this lesson to earn points for purchasing other TpT products.


