118 results
Adult education graphing resources for Microsoft PowerPoint
3rd Grade Math Jeopardy Game - Measurement and Data 3.MD.4 with Google Slides
Third Grade Common Core Math Jeopardy Game - 3 MD.4 Measurement and Data 3.MD.4 Practice provides two ways for students to practice and show mastery of their Measurement and Data skills. Jeopardy board includes 25 distinct problems and utilizes hyperlinks to award/deduct money from your student teams! (79 slides in all!) Board is automatically updated to show which questions have already been utilized. Also includes an Answer Key if you wish to use questions as Quiz/Test. The PowerPoint file can
Subjects:
Grades:
3rd, Adult Education
CCSS:

Practice Reading Graphs: USA Today, PowerPoint Version
This PowerPoint presents 10 graphs from the popular "USA Today Snapshots" to provide practice with all aspects of reading graphs - interpreting data, drawing conclusions, recognizing sources, etc. There are 4-5 questions for each graph that challenge students to apply critical thinking skills to the graph data. For each graph, the first question is displayed, then the next slide displays the answer and the next question. This format is perfect for whole group practice. Reinforce this l
Subjects:
Grades:
6th - 9th, Adult Education
Types:
6th Grade - Coordinate Plane Powerpoint Lesson
6th Grade Coordinate Plane - This is perfect for distance learning on Zoom or similar formats. On top of that it is powerful when used as direct instruction in the classroom. It teaches students how to locate and name points in the coordinate plane in all 4 quadrants. In addition, they learn the terms and concepts of grid, coordinate plane, x axis, y axis, coordinate pair and rules governing the placement of plots. There are 22 effective teaching strategies based on research used in this le
Subjects:
Grades:
6th, Adult Education
Also included in: 6th Grade Powerpoint Mega Math Bundle - 58 Lessons - 2923 Slides
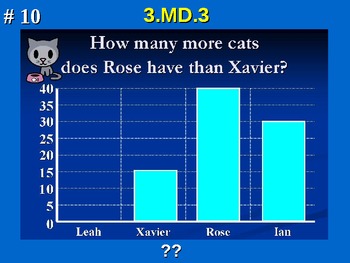
3rd Grade Common Core Math 3.MD.3 Measurement and Data
Third Grade Common Core Math 3 MD.3 Measurement and Data Practice provides two ways for students to practice and show mastery of their measurement skills.
It includes 40 distinct problems in two sets (129 slides in all!), with and without following answer slides. The PowerPoint file can be used on computers, or Promethean and Smart boards.
Take a look at the preview file and buy today for your students benefit!
3.MD.3 Represent and interpret data.
3. Draw a scaled picture graph and a scal
Subjects:
Grades:
3rd, Adult Education
CCSS:
Also included in: 3.MD.3 3rd Grade Math - Draw Scaled Picture & Bar Graph Bundle w/ Google
5.MD.2 5th Grade Math Jeopardy Game - Measurement and Data w/ Google Slides
Fifth Grade Math Jeopardy Game - 5 MD.2 Measurement and Data 5.MD.2 Practice provides two ways for students to practice and show mastery of their ability to represent and interpret data. Jeopardy board includes 25 distinct problems and utilizes hyperlinks to award/deduct money from your student teams! (79 slides in all!) Board is automatically updated to show which questions have already been utilized. Also includes an Answer Key if you wish to use questions as Quiz/Test. The PowerPoint file can
Subjects:
Grades:
5th, Adult Education
CCSS:
6th Grade Statistics & Data 1 - Statistical Questions & Types of Data Lesson
Sixth Grade Statistics 1 - Statistical Questions and Types of Data Powerpoint Lesson is powerful when used as direct instruction in the classroom, online, or individually. It teaches students how to recognize and pose a statistical question. Students also learn the difference between numerical and categorical data. They also learn the 4 basic steps in presenting data: posing a statistical question, gathering the data, displaying the data, and answering the question they posed. There are 22
Subjects:
Grades:
6th, Adult Education
CCSS:
Also included in: 6th Grade Statistics & Data Bundle - 6 Powerpoint Lessons - 402 Slides

Desmos Graphing Project (Review)
This project is meant as a review of linear functions as well as transformations in the coordinate plane (translations, reflections, rotations, dilations). Students get to choose which transformation to perform, so it does not "review all transformations". Students use Desmos to outline a letter, usually an initial, (restricting domain and range) and then transform it within Desmos (in a table). For easier projects: pick transformations for students to perform (translations, dilations) and walk
Grades:
8th - 12th, Higher Education, Adult Education
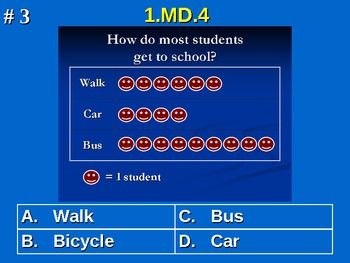
1st Grade Common Core Math 1 MD.4 Interpret Data 1.MD.4
First Grade Common Core Math 1 MD.4 Interpret Data 1.MD.4 Practice provides two ways for students to practice and show mastery of their ability to represent and interpret data.
It includes 40 distinct problems in two sets (129 slides in all!), with and without following answer slides. The PowerPoint file can be used on computers, or Promethean and Smart boards.
Take a look at the preview file and buy today for your students benefit!
Standard 1.MD.4 Represent and interpret data.
4. Organiz
Subjects:
Grades:
1st, Adult Education
CCSS:
Also included in: 1.MD.4 1st Grade Math - Interpret Data Bundle with Google
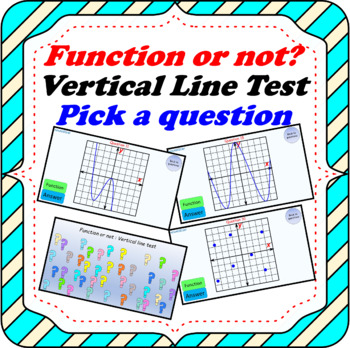
Function or not Vertical Line Test - Powerpoint and print version BUNDLE deal
This is a bundle of the very popular "Vertical Line Test" with 30 questions to help students practice functions and vertical line test. This contains 2 files: a PDF version and a PowerPoint game version.The students must examine each diagram, and decide, by using the straight line test, whether the graph is a function or not.All answers are included.***********************************************************************************************************************************I hope you find
Subjects:
Grades:
10th - 12th, Adult Education
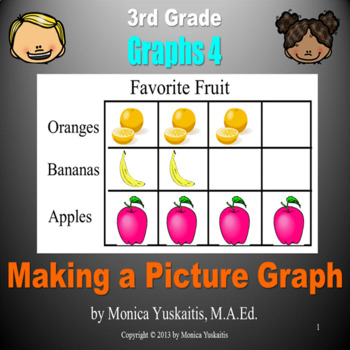
3rd Grade Graphs 4 - Making a Picture Graph Powerpoint Lesson
Third Grade Graphs 4 - Making Picture Graphs - This is perfect for distance learning on Zoom or similar formats. On top of that it is powerful when used as direct instruction in the classroom. It teaches students how to make a picture graph. In addition, the main parts of the picture graph are also taught. The following concepts are reviewed: grid, graph, coordinates, axes, scale, interval, title, and key. There are 22 strategies of effective teaching based on research in this powerpoint les
Subjects:
Grades:
3rd - 4th, Adult Education
CCSS:
Also included in: 3rd Grade Graphs Bundle - 6 Powerpoint Lessons - 277 Slides
3rd Grade Graphs 1 - Bar & Line Graphs Powerpoint Lesson
Third Grade Graphs 1 - Bar & Line Graphs introduces the students to graphs in general and emphasizes bar and line graphs. This is perfect for distance learning on Zoom or similar formats. On top of that it is powerful when used as direct instruction in the classroom. The following concepts are taught: grid, graph, coordinates, axes, scale, interval, title, key and how to solve problems using a bar or line graph. This lesson is based on 22 principles of effective teaching based on resear
Subjects:
Grades:
3rd - 5th, Adult Education
CCSS:
Also included in: 3rd Grade Graphs Bundle - 6 Powerpoint Lessons - 277 Slides
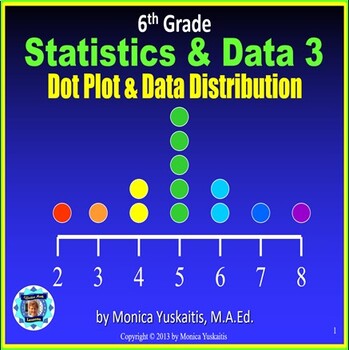
6th Grade Statistics & Data 3 - Dot Plot and Data Distribution Powerpoint Lesson
Sixth Grade Statistics 3 - Dot Plot and Data Distributions Powerpoint Lesson - is powerful when used as direct instruction in the classroom, online, or individually. It teaches students how to read and create dot plots. In addition, students learn to analyze the data as to its center, spread, and most common numbers. There are 22 strategies of effective teaching based on research. For best results, students should have white boards and dry erase markers. For instructions on how to successf
Subjects:
Grades:
6th, Adult Education
CCSS:
Also included in: 6th Grade Statistics & Data Bundle - 6 Powerpoint Lessons - 402 Slides
Histograms and Frequency Tables (Powerpoint) for Busy Teachers
This powerpoint presentation introduces the concept of histograms and frequency tables.
Clipart, sounds, and animation are used sparingly and effectively to help illustrate points without being distracting. This powerpoint presentation has been extensively refined using faculty AND student input and feedback.
Definitions of histogram, interval, frequency table, and frequency are all presented. The progression from a frequency table to a completed histogram is illustrated and animated using
Subjects:
Grades:
4th - 12th, Higher Education, Adult Education
6th Grade Statistics & Data 4 - Histogram Powerpoint Lesson
Sixth Grade Statistics 4 - Histogram Powerpoint Lesson is powerful when used as direct instruction in the classroom, online or individually. It teaches students how to identify a histogram and how to make one. Comparisons are made between a bar graph and a histogram. Many terms are defined such as axis, scale, frequency, count, range, interval, mound, skewed left, skewed right and more. There are 22 effective teaching strategies based on research used in this lesson. For best results, stud
Subjects:
Grades:
6th, Adult Education
Types:
Also included in: 6th Grade Statistics & Data Bundle - 6 Powerpoint Lessons - 402 Slides

Rio Olympics 2016 Medal Tally
This is designed to engage and excited students in the Rio Olympics for 2016, use this medal tally to track your country or other countries medal count.
Grades:
PreK - 12th, Higher Education, Adult Education, Staff
Types:

Systems of Equations and Inequalities- jeopardy style game
This is a game based on the jeopardy game show idea and it includes the following topics:
1_ Solving Systems of Linear Equations by Graphing, Elimination and Substitution Methods
2_Solving Systems of Linear Inequalities
3_Solving Systems of Equations in 3 variables by Elimination or Substitution
Playing a game before a test, is usually a very exciting time for my students, they love playing a game right before a test. After a few years of using this practice, it seems that this type of review g
Subjects:
Grades:
7th - 11th, Higher Education, Adult Education
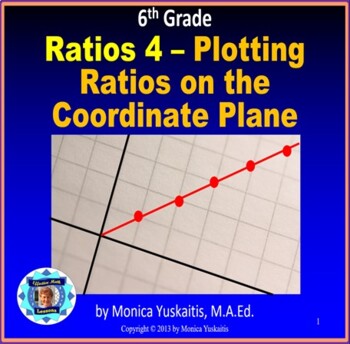
6th Grade Ratios 4 - Plotting Ratios on the Coordinate Plane Powerpoint Lesson
Sixth Grade Ratios 4 - Plotting Ratios on the Coordinate Plane - This is perfect for distance learning on Zoom or similar formats. On top of that it is powerful when used as direct instruction in the classroom. It teaches students how to develop a table of equivalent ratios, write an equation from that information, and then plot the pairs on the coordinate plane. There are 22 effective teaching strategies based on research used in this lesson. For best results, students should have white b
Subjects:
Grades:
6th, Adult Education
BUNDLE: Functions and Relations Power Point with Corresponding Lab/ NO PREP
Students find the following lesson and corresponding activity to be an exhilarating mathematical experience!* Why?* They find it exhilarating, because after going through the lesson and the accompanying activity, they readily understand a simple but confusing concept. * The power point includes a 39 page power point over Functions and Relations along with a 19 page Math Lab written by yours truly. * The Math Lab provides "hands-on" experience to students where they use a pair of
Subjects:
Grades:
6th - 9th, Higher Education, Adult Education
Algebra Power-Point: The Coordinate Plane with GUIDED NOTES/DISTANCE LEARNING
I am very excited to share with you my power point on The Coordinate Plane. ^ This forty-seven page presentation brings students into a whole new realm of mathematics where algebra and geometry meet for the first time in the world of numbers. * I have included a bit of history trivia as to how the coordinate plane arrived with its name, "The Cartesian Plane," and an interesting tid-bit about it's creator. * From there, the lesson discusses the origin, x-axis, y-axis, ordered pairs
Grades:
6th - 10th, Higher Education, Adult Education
CCSS:
Also included in: BUNDLE: Algebra Power-point Graphing Linear Equations and Functions
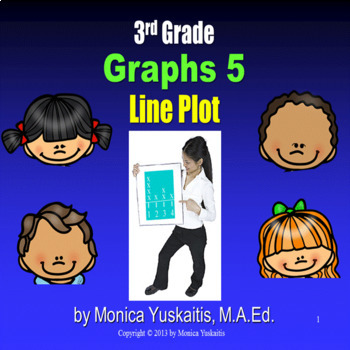
3rd Grade Graphs 5 - Line Plots Powerpoint Lesson
Third Grade Graphs 5 - Line Plots - This is perfect for distance learning on Zoom or similar formats. On top of that it is powerful when used as direct instruction in the classroom. It introduces the students to line plots. The following concepts are taught: grid, graph, coordinates, axes, scale, interval, title, and key. There are 22 strategies of effective teaching based on research in this powerpoint lesson. For best results, students should have white boards and dry erase markers. I
Subjects:
Grades:
3rd - 4th, Adult Education
Also included in: 3rd Grade Graphs Bundle - 6 Powerpoint Lessons - 277 Slides

4th Grade Graphs - Making Line Plots Powerpoint Lesson
Fourth Grade Graphs - Making Line Plots - This is perfect for distance learning on Zoom or similar formats. On top of that it is powerful when used as direct instruction in the classroom. It teaches the students how to collect data and then make a line plot with that data. Students also review using a ruler to measure to the eighth of an inch and use this knowledge in making their line plot. There are 22 effective teaching strategies used in this lesson base on research. For best results,
Subjects:
Grades:
4th, Adult Education
CCSS:

Introduction to Sharks, Skates and Rays
Biology, Marine Biology, Upper Level Elementary ScienceIncluded in the package:- Introduction to Sharks Powerpoint (41 slides)- Shark Anatomy Powerpoint (46 slides)- Cartilaginous Fish (Rays & Skates) (44 slides)- Shark Game Show (Jeopardy style) Review PowerpointTo assess:- Shark Test- Shark Test Study Guide- Shark Test Study Guide ANSWERS- Cartilaginous Fish Quiz - Cartilaginous Fish Quiz ANSWERSStudents Research and Activities:- Shark Species Internet Research Questions- Shark Species Pre
The Basics of Algebra Theory: From Variables to Graphing in Power Point
Feeling a bit OVERWHELMED and Need to Teach ALGEBRA THEORY? Then here is a power point presentation to present to your students while feeling confident in your skills. Each slide will present my style for teaching the basics of Algebra theory with my actual lecture presentations. Topics covered in this presentation are:What is a variable?Basic terminology.Evaluating an open sentence using a replacement set.Order of operation (PEMDAS).Operating on signed numbers.Combining similar terms.Solving
Grades:
4th - 12th, Adult Education, Staff
Algebra Power-point: Solving Quadratic Equations by Graphing with GUIDED NOTES
The following lesson covers "Solving Quadratic Equations by Graphing".
* Students begin by reviewing Standard Form for a Quadratic Equation
* Students learn where to locate the solutions to a Quadratic Equation on the Cartesian Plane.
* Students learn three inter-changeable ways to refer to the solutions to a Quadratic Equation.
* Students learn the steps necessary to find the solutions of a Quadratic Equation
* Students learn and explain in their own words what the graph of a Quadra
Subjects:
Grades:
8th - 11th, Higher Education, Adult Education
Showing 1-24 of 118 results


