84 results
Adult education statistics resources for Google Apps

IB Psychology Internal Assessment (IA) Analysis and Statistics Slides
Walk your students through the Analysis section of the Internal Assessment (IA). Google slides include content and background information on statistics, directions and links for students to follow while they write their Analysis section, create their table and graph, and run descriptive statistics and inferential statistics with their raw data. Includes links to online calculators for mean, standard deviation, Mann Whitney U Test, Wilcoxon Test. Analysis rubric and links to two IA exemplars incl
Subjects:
Grades:
9th - 11th, Higher Education, Adult Education
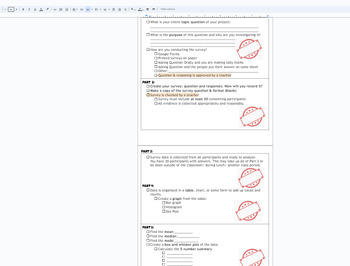
Statistics Survey project Discovery (broken down into sections) with Rubric
This is a broken down (scaffolded) packet of instructions/ guide for a Stats Project for Math 1 HS or 8th grade students. The goal of the project is for students to take a statistical survey on quantitative data (numbers) of their choice. Using this data from the survey, the following will be included in the project:Survey- the question being askedSurvey responses (requirement of 30)Data organization: Bar chart, Histogram, Dot PlotMeanMedianModeBox and Whisket Plot5 number summary (Q1,Q2,Q3, min
Subjects:
Grades:
7th - 12th, Higher Education, Adult Education
CCSS:
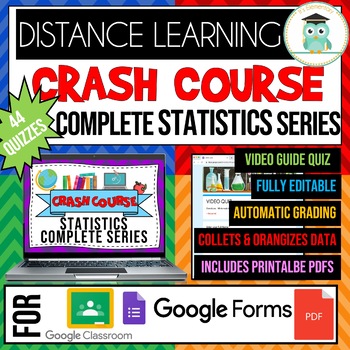
COMPLETE CRASH COURSE Statistics Series Video Quiz Google Forms Bundle
These are GOOGLE FORMS quizzes and printable PDF worksheets for 44 CRASH COURSE STATISTICS SERIES VIDEOS. Each product includes:2 Differentiated Versions of the QuizEasy Version (With a Word Bank)Harder Version (Without a Word Bank)These quizzes can be used as a video guide to hold students accountable as they watch the video. It can also be used as a video quiz to assess student learning or as part of homework. These quizzes can be assigned to your GOOGLE CLASSROOM for DISTANCE LEARNING.The GO
Subjects:
Grades:
9th - 12th, Higher Education, Adult Education
Types:
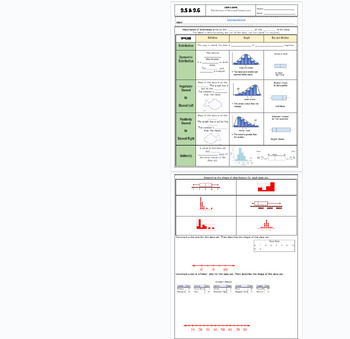
Data Distribution positive/negative skewed fillable notes UPDATED
Unit 9: Data and Stats: Updated(No 9.3/ Skip)9.5/9.6 Data Distribution (skewness)Students go over the vocabulary and complete the examples with the vocabulary scaffolded. Skewness is explained and how to identify it comparing data charts and box and whisker plots. Uses many visuals and examples to differentiate between that different graphs. Notes are scaffolded. Includes hook video hyperlinked on the "learning objective" title. Key is included and hyperlinked as a PDF in the heading highlighted
Subjects:
Grades:
6th - 12th, Higher Education, Adult Education
CCSS:
Also included in: Unit 9: Data and Statistics Fillable Notes
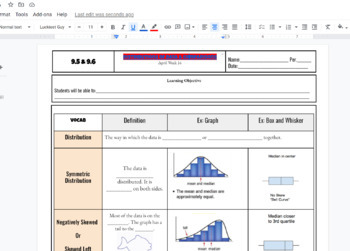
Distributions of Data Scaffolded Fillable Notes (Skewed Left & right) w/ KEY
Distributions of Data Scaffolded Fillable Notes (Skewed Left & right) Includes a problem of creating box plot, bar chart, and dot plot. KEY IS INCLUDED linked at top of title highlighted in red!!! , Algebra 1 or Math 1 class in highschool setting IEP 504 EL learners visuals for better understanding. YOU CAN EDIT THE GOOGLE DOC to your liking!!!
Subjects:
Grades:
7th - 12th, Higher Education, Adult Education
CCSS:

Wisconsin Fast Plants Online Simulation Lab
This comprehensive worksheet has students evaluate genetics using the free online lab through Gizmos (this simulation is currently FREE with the creation of an account (which is also FREE). Students will explore:- tracking parentage based on F1 and F2 phenotypes- statistical analysis using Chi Squared calculations - gene linkage evaluation and gene mapping using recombination frequencies Perfect for remote learning! Everything is included for guided learning AND independent practice to really g
Subjects:
Grades:
9th - 12th, Higher Education, Adult Education, Staff
Types:
Standard Deviation Fillable Notes UPDATED
Unit 9: Data and Stats: Updated(No 9.3/ Skip)9.4 B Standard DeviationStudents go over the vocabulary and complete the examples with the vocabulary scaffolded. Standard deviation is long hand calculated by showing each step of the process (difference of squares). Real-world examples are explained in notes before calculating to show the importance of this stat and why it is used so often to verify valuable and effective data. Notes are scaffolded. Includes hook video hyperlinked on the "learning o
Subjects:
Grades:
7th - 12th, Higher Education, Adult Education
CCSS:
Also included in: Unit 9: Data and Statistics Fillable Notes

Cell Cycle Experimental Design Online Lab
Use data from real pictures of onion root tips to evaluate the effect of lectin on mitotic rate! A classic AP Biology Lab turned virtual for remote learning. Students use a google slide presentation to collect and share data, perform statistic testing (including standard deviation and Chi Square analysis) before evaluating the true effect of lectin on mitosis!Check out the data collection slides in the preview!
Subjects:
Grades:
9th - 12th, Higher Education, Adult Education, Staff
Types:
Also included in: Chi Square Bundle!
Graphical Data: Bar Charts, Dot Plots and Histograms fillable notes UPDTD
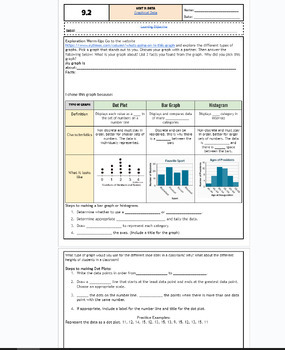
Unit 9: Data and Stats: UpdatedUpdated9.2 Graphs: bar, dot plot, histpgramStudents go over the vocabulary and define each type fo graph and what data fits for each graph. The warm up is an exploratory activity where students go on a website to search for their graph of interest and discuss the key findings. This takes around 10-15 mins and students enjoyed it! Notes are scaffolded. Includes hook video hyperlinked on the "learning objective" title. Key is included and hyperlinked as a PDF in the
Subjects:
Grades:
6th - 12th, Higher Education, Adult Education
CCSS:
Also included in: Unit 9: Data and Statistics Fillable Notes
Crime Rate Analysis Assignment
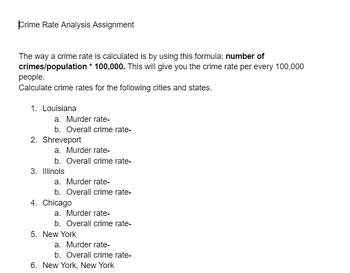
A web based assignment to allow students to calculate the crime rates of various U.S. cities.
Grades:
5th - 12th, Higher Education, Adult Education
Types:
Valentines Day Digital Resource Claim Evidence Reasoning (CER) - Data and Stats
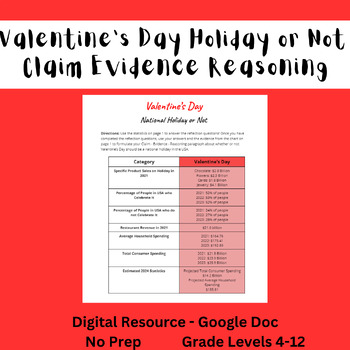
This activity is a printable, NO PREP activity to do the week of Valentine's Day! This activity outlines lots of statistics and data about Valentine's Day and asks students to objectively argue whether or not it should be a national holiday in the USA based on the statistics. There are guided reflection questions to help students with the process, before asking them to write a final decision using Claim Evidence Reasoning. This is also a great way to introduce, reinforce, or practice creative wr
Grades:
4th - 12th, Higher Education, Adult Education, Staff
Types:

Knowledge Check Research Methods in Political Science
Multiple choice knowledge check assessment made in Google Forms and made for online completion with compatible learning management systems. Open-ended response questions to gauge indivduals' independent critical think skills or a collaborative prompt to engage students working together to build on responses with replies that elevate a community-level understanding asynchronously, online, in person, in groups, or to design project based on showing how they can best articulate their understanding
Grades:
12th, Higher Education, Adult Education
Types:
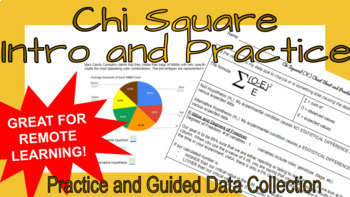
Chi Square Introduction and Practice Lab
This is an all in one worksheet with an introduction to Chi Square Analysis. Includes a breakdown of the ins and outs of Chi Square, null and alternative hypothesis development, and a script to help with the analysis of chi square data.Also includes a virtual version of the popular M&M data collection lab! Find the data collection slides in the preview!
Subjects:
Grades:
9th - 12th, Higher Education, Adult Education, Staff
Types:
Also included in: Chi Square Bundle!
Crash Course Statistics #10 Sampling Methods and Bias with Surveys Google Quiz
These are GOOGLE FORMS quizzes and printable PDF worksheets for the CRASH COURSE video:Statistics #10 Sampling Methods and Bias with SurveysThis product includes:2 Differentiated Versions of the QuizEasy Version (With a Word Bank)Harder Version (Without a Word Bank)These quizzes can be used as a video guide to hold students accountable as they watch the video. It can also be used as a video quiz to assess student learning or as part of homework. These quizzes can be assigned to your GOOGLE CLAS
Subjects:
Grades:
9th - 12th, Higher Education, Adult Education
Types:
Also included in: COMPLETE CRASH COURSE Statistics Series Video Quiz Google Forms Bundle
Probability Escape Room - Magic Themed
This escape room has a spooky, magical feel! It contains five probability questions and a few puzzles to crack the ultimate code!This escape room is on Google Slides and can be done collaboratively as a class, or independently on separate devices! Duration is about 60 minutes. Teacher guidelines, student worksheet, and answer key included!
Subjects:
Grades:
9th - 12th, Higher Education, Adult Education
Types:
Normal Distribution Curve with Google Sheets —Distance Learning
In this lesson, you will learn how to create a normal distribution curve with Google Sheets. A normal distribution curve is a Bell curve. Here are some of the things you will learn.query the data into a new sheetsort and filter the dataUse Named Rangesuse AVERAGE, MEDIAN, MODE, and STANDARD DEVIATION functionsUse the Frequency distribution function for the Histogram chartUse the Normal Distribution functionGraph the normal distributioncompare the normal distribution to the histogram
Subjects:
Grades:
3rd - 12th, Higher Education, Adult Education, Staff
Types:

Analyzing and Interpreting Quantitative Data Assessment
This product contains a set of 26 multiple-choice questions focused on quantitative data analysis. It is designed for educators, researchers, and students who want to test their knowledge or prepare for exams in this field.Each question is structured to test the reader's understanding of a specific aspect of quantitative data analysis. The questions cover a range of topics, including statistical software selection, data cleaning, missing data, hypothesis testing, and effect size.The questions ar
Subjects:
Grades:
11th - 12th, Higher Education, Adult Education
Types:
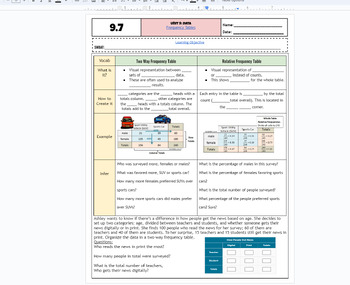
Frequency Tables & Relative Frequency Tables fillable notes UPDATED
Unit 9: Data and Stats: Updated(No 9.3/ Skip)9.7 Frequency Tables Students go over the vocabulary and complete the examples with the vocabulary scaffolded. Students examine a categorical table/frequency table and also use that information to create relative frequency tables. Different real-world examples and problems are used. Emphasized how percents and decimals are calculated. Notes are scaffolded. Includes hook video hyperlinked on the "learning objective" title. Key is included and hyperli
Subjects:
Grades:
6th - 12th, Higher Education, Adult Education
CCSS:
Also included in: Unit 9: Data and Statistics Fillable Notes
Crash Course Statistics #18 Z-Scores and Percentiles Google Forms Quiz
These are GOOGLE FORMS quizzes and printable PDF worksheets for the CRASH COURSE video:Statistics #18 Z-Scores and PercentilesThis product includes:2 Differentiated Versions of the QuizEasy Version (With a Word Bank)Harder Version (Without a Word Bank)These quizzes can be used as a video guide to hold students accountable as they watch the video. It can also be used as a video quiz to assess student learning or as part of homework. These quizzes can be assigned to your GOOGLE CLASSROOM for DIST
Subjects:
Grades:
9th - 12th, Higher Education, Adult Education
Types:
Also included in: COMPLETE CRASH COURSE Statistics Series Video Quiz Google Forms Bundle
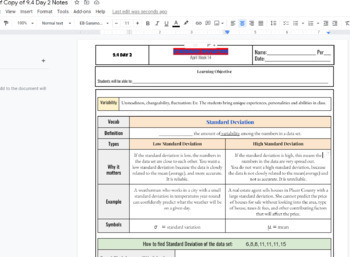
Standard Deviation Scaffolded Fillable Notes AND key
Standard Deviation Scaffolded Fillable Notes AND key, give definitions to the terms with real-world examples! Includes a video link in the notes as the intro to the lesson by describing the meaning and need for standard deviation in the simplest form possible! The key is linked at the top of notes as well that will download as a pdf- not a google doc- did not do the last problem on the bottom as it was an exit ticket for students (no layout).
Subjects:
Grades:
7th - 12th, Higher Education, Adult Education
CCSS:
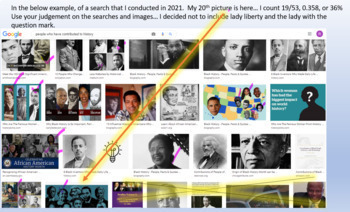
Women's History Month Probability Project
Students learn about suffrage and representatio of women. Students conduct Google searches on favorite subject, sport/hobby, future career and find the probability of a woman appearing in the first 20 images. Students make conjectures about representation of women in those areas. Students identify women they admire and create a video summarizing their findings.Can be adapted to images for African Americans for Black History Month, Hispanic Americans for Hispanic Heritage Month, etc.
Subjects:
Grades:
6th - 12th, Adult Education, Staff
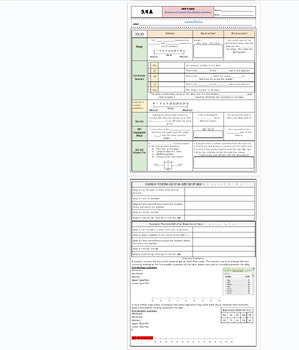
5 Number Summary and Box and Whisker Plots Fillable Notes UPDATED
Unit 9: Data and Stats: Updated(No 9.3/ Skip)9.4 A 5-number summary and box and whisker plot Students go over the vocabulary ad complete the examples with the vocabulary scaffolded. for each statistic with an explanation of the purpose of the 5 number summary and why these are used. Notes are scaffolded. Includes hook video hyperlinked on the "learning objective" title. Key is included and hyperlinked as a PDF in the heading highlighted in the orange box, and at the bottom of the google doc as w
Subjects:
Grades:
6th - 12th, Higher Education, Adult Education
CCSS:
Also included in: Unit 9: Data and Statistics Fillable Notes
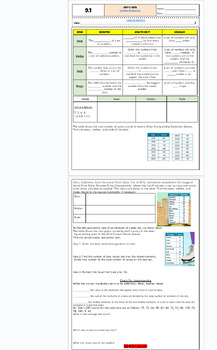
Central Tendencies: Mean, Median and Mode fillable notes: Updated
Unit 9: Data and Stats Updated9.1 Central Tendencies: mean median and modeStudents go over the vocabulary and how to find each average with examples. Notes are scaffolded. Includes hook video hyperlinked on the "learning objective" title. Key is included and hyperlinked as a PDF in the heading highlighted in the orange box, and at the bottom of the google doc as well. Google doc is editable, used in M1 HS
Subjects:
Grades:
6th - 12th, Higher Education, Adult Education
CCSS:
Also included in: Unit 9: Data and Statistics Fillable Notes

Invisible Women - Podcast Questionnaire
This 25 minute podcast sheds a light on the everyday designs created without females taken into consideration. The author, Caroline Criado Perez, is interviewed about her book; Invisible Women: Data Bias in a World Designed by Men. She gives examples of biases and alerts the designing communities of their obligation to consider women in policy designs and experiments. Inform and engage our future artists, politicians and scientists in a discussion about designing without disaggregated data a
Grades:
11th - 12th, Higher Education, Adult Education
Types:
Showing 1-24 of 84 results


