18 results
Adult education statistics videos

Statistics Unit 3--Measures of Position
Unit 3: Measures of Position3.1 Quartiles3.2 Percentiles3.3 Z-ScoresUnit 3 ReviewUnit 3 TestThis course is designed for a high school classroom. It's meant to be an informative and fun general statistics course covering:1. Descriptive Statistics2. Study Design3. Probability4. A selection of Inferential Statistics
Subjects:
Grades:
9th - 12th, Higher Education, Adult Education
Types:

Common Core Math Activity (Math scores)- Statistics (Measure of Variation)
Use engaging animation of Math problem and worksheet to review Common Core Math skills.
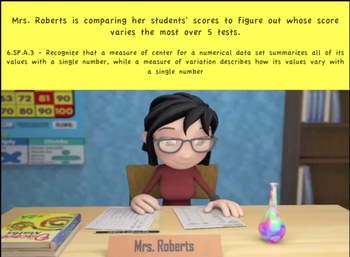
Mrs. Roberts is comparing her students' scores to figure out whose score varies the most over 5 tests.
You can use this activity as warm up/bell ringers, review, group activity, and remedial-activity. The voice-over/narration makes it an excellent tool for different learning styles and ESL learners.
Included:
* 3D animation video (less than 2 minutes long) showing the Math problem scenario with text d
Subjects:
Grades:
5th - 7th, Adult Education, Staff
Types:
CCSS:

Common Core Math Activity – Statistics (Mean)-6.SP.A.3
Use engaging animation of Math problem and worksheet to review Common Core Math skills.
We think Lauren should cut down her TV watching time. What do you think? Watch this animation to answer the question about Lauren's TV watching time..
You can use this activity as warm up/bell ringers, review, group activity, and remedial-activity. The voice-over/narration makes it an excellent tool for different learning styles and ESL learners.
Included:
* 3D Animation video (less than 2 minutes lon
Subjects:
Grades:
5th - 7th, Adult Education
Types:
CCSS:
21:42
Flipped Lecture - Ch19 One Proportion z-intervals
The following is part of flipped classroom for AP Statistics: One Proportion z-Intervals that completely explains the process and procedures and understandings required to successfully implement confidence intervals. While proportions are the parameter for this unit, many of the same ideas are used with One Sample t-Interval for Means.These videos are a complete lecture that is suitable to replace direct instruction in the classroom. The videos present statistics in an engaging and approachabl
Subjects:
Grades:
9th - 12th, Higher Education, Adult Education, Staff
22:21
Flipped Lecture - Ch23 One Sample t-Test for Means
The following is part of flipped classroom for AP Statistics: One Proportion z-Intervals that completely explains the process and procedures and understandings required to successfully implement hypothesis testing for one sample with means using p-Value and confidence intervals. The t-curve is explained in detail within this video. While means are the parameter for this unit, many of the same ideas are used with proportions.These videos are a complete lecture that is suitable to replace direct
Subjects:
Grades:
9th - 12th, Higher Education, Adult Education, Staff
15:51
Easy Analytics: Basic Forecasting Video
This video explains how to do basic forecasting. The information can be used for an applied math, statistics, business, or entrepreneurship course. This video explains how to perform the three basic forecasting methods -- Last Value, Average, and Moving Average -- and use them to predict a next period's value. The mathematics involved is basic with the most complicated operation being finding an average. This video can be used in conjunction with the Easy Analytics: Basic Forecasting publica
Subjects:
Grades:
10th - 12th, Higher Education, Adult Education
Also included in: Easy Analytics: Basic Forecasting Bundle
27:40
Easy Analytics: Intermediate Forecasting
This video provides an explanation of how to do two intermediate methods of forecasting. The student will see how to perform linear regression and exponential smoothing using formulas. The mathematic requirements for the student is a knowledge of how to use formulas.
Subjects:
Grades:
10th - 12th, Higher Education, Adult Education
Also included in: Easy Analytics: Beginning and Intermediate Bundle
21:26
Flipped Lecture-Ch26 - Chi-Square Test(Goodness of Fit,Homogeniety,Independence)
The following is part of flipped classroom for AP Statistics: One Proportion z-Intervals that completely explains the process and procedures and understandings required to successfully complete an appropriate Chi Square Test. This also explains how to do calculations by hand and on the graphing calculator.These videos are a complete lecture that is suitable to replace direct instruction in the classroom. The videos present statistics in an engaging and approachable format. If you're looking to
Subjects:
Grades:
9th - 12th, Higher Education, Adult Education, Staff
16:20
Flipped Lecture-Ch21 Understanding Type I&II Error & Relationships w/i Inference
The following is part of flipped classroom for AP Statistics: One Proportion z-Intervals that completely explains the process and procedures and understandings required to pick the right features of a hypothesis test. This video goes into depth explaining the relationships between Type I and II errors and its relationship to the power of a test. It also discusses how to combine confidence intervals and hypothesis testing using p-value so that very strong evidence is presented in a conclusion.
Subjects:
Grades:
9th - 12th, Higher Education, Adult Education, Staff
18:05
Flipped Lecture-Ch24 - 2 Sample t-Test and t-Interval for Means
The following is part of flipped classroom for AP Statistics: One Proportion z-Intervals that completely explains the process and procedures and understandings required to successfully complete a 2 sample independent hypothesis test and confidence interval for means. It is also discussed why it is recommended NOT to pool, unlike with proportions. These videos are a complete lecture that is suitable to replace direct instruction in the classroom. The videos present statistics in an engaging a
Subjects:
Grades:
9th - 12th, Higher Education, Adult Education, Staff
21:11
Flipped Lecture - Ch18 Sample vs. Sampling Distribution (Central Limit Theorem)
The following is part of flipped classroom for AP Statistics in its introduction to Central Limit Theorem. This video gets into the details of calculating probability using a sample distribution vs. sampling distribution. This video sets the stage for confidence intervals and hypothesis testing.These videos are a complete lecture that is suitable to replace direct instruction in the classroom. The videos present statistics in an engaging and approachable format. If you're looking to create a
Subjects:
Grades:
9th - 12th, Higher Education, Adult Education, Staff
17:20
Flipped Lecture-Ch22 - 2 Sample Proportion z-Test
The following is part of flipped classroom for AP Statistics: One Proportion z-Intervals that completely explains the process and procedures and understandings required to succesfully complete a 2 sample proportion hypothesis test and confidence interval. It also discusses the differences in calculating confidence intervals and hypothesis testing using p-value. While proportions are the parameter for this unit, many of the same ideas are used with One Sample t-Interval for Means.These videos
Subjects:
Grades:
9th - 12th, Higher Education, Adult Education, Staff
17:40
Flipped Lecture - Ch20 One Proportion z-Test
The following is part of flipped classroom for AP Statistics: One Proportion z-Intervals that completely explains the process and procedures and understandings required to successfully implement confidence intervals. While proportions are the parameter for this unit, many of the same ideas are used with One Sample t-Interval for Means.These videos are a complete lecture that is suitable to replace direct instruction in the classroom. The videos present statistics in an engaging and approachabl
Subjects:
Grades:
9th - 12th, Higher Education, Adult Education, Staff
8:14
Mathematics Statistics - Mean of Grouped Data - Problem Solving (Assumed mean)
This video contains problem solving session on Mean of grouped data by assumed mean method
"While finding the mean by direct method, it may happen that the numbers in the columns come out to be very large which becomes tedious to calculate the value. So we use Assumed Mean Method to calculate theh mean of such data.
It will give you same information if calculated by using direct method, the only importance of this method is that it reduces time and makes the process less tedious. "
1. Intro
Subjects:
Grades:
8th - 12th, Higher Education, Adult Education
6:29
Mathematics Statistics - Mean of Grouped Data - Problem Solving (Direct mean)
This video contains problem solving session on Mean of grouped data by direct mean method .
"Mean is one of the measures of central tendency. In this session you will learn about how to find the mean of a group data, this method is also known as Direct Mean Method.
Watch this video and learn the direct method to find the mean of a group data."
1. Introduction
2. Mean of Grouped Data
4. Mean of Grouped Data Problem Solving 2 (Assumed Mean method)
5. Mean of Grouped Data Problem Solving
Subjects:
Grades:
7th - 10th, Higher Education, Adult Education
Types:
8:04
Mathematics Statistics-Mean of Grouped Data - Problem Solving (Step Deviation)
This video contains problem solving session on Mean of grouped data by step deviation method
Subjects:
Grades:
8th - 12th, Higher Education, Adult Education
Types:
6:09
MathData Handling Tally Marks Statistics - Algebra
"This video covers:
1) Introduction of data ,
2) Definition of data ,
3) Types of data ,
4) Step of tally marks and
5) Types of grouped data."
Subjects:
Grades:
7th - 11th, Higher Education, Adult Education
Types:
11:47
Free Download - How to determine Significant Digits using map of U.S.
I have the easiest way to learn about significant figures! If you don't believe me, give my video a try. Teaching them will forever be easier if you learn my way.
Subjects:
Grades:
9th - 12th, Higher Education, Adult Education, Staff
Types:
Showing 1-18 of 18 results


