83 results
3rd grade statistics resources for Microsoft PowerPoint
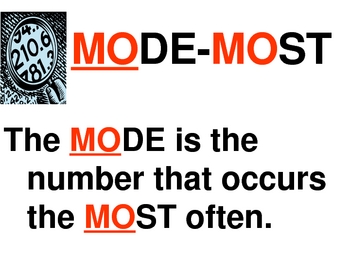
Statistics Mean, Median, Mode & Range Interactive PowerPoint by Erica
Introduce statistics including mean, median, mode and range with this colorful, interactive 22 slide PowerPoint. This interactive PowerPoint introduces each term and teaches a strategy for finding the value. There is also a trick or visual to help students remember the steps to find each one (mean, median, mode and range). Students are able to practice finding the mean, median, mode and range and then check within the PowerPoint. This is excellent for a statistics lesson or for students to e
Subjects:
Grades:
3rd - 6th
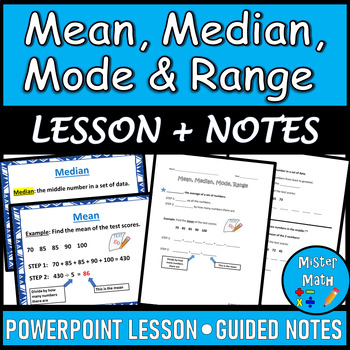
Mean, Median, Mode & Range PPT and Guided Notes BUNDLE
This Mean, Median, Mode & Range BUNDLE includes a PowerPoint Lesson and a corresponding Guided Notes Packet to assist students in learning about finding the mean, median, mode, and range of data sets. The PowerPoint and Guided Notes packet include key vocabulary, as well as an example for each skill. Additional practice problems are included that ask students to find the mean, median, mode and range of four data sets (for a total of 16 extra practice problems!) The presentation also comes fu
Subjects:
Grades:
3rd - 6th
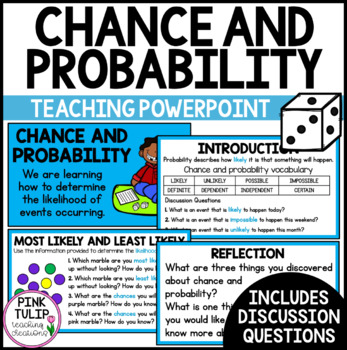
Chance and Probability - Teaching PowerPoint Presentation
Chance and Probability - Teaching PowerPoint PresentationCurriculum aligned PowerPoint presentation to guide explicit teaching of chance and probability, including likelihood. Includes:Learning intention.Introduction (tune in). Engaging graphics.Detailed explanations of various chance events.An in-depth vocabulary of terms such as likelihood, probability, chance, independent, dependent, and impossible.Discussion questions with answers.Reflection slides.Glossary. US spelling and UK spelling vers
Subjects:
Grades:
3rd - 5th
Also included in: Math PowerPoint Presentations Bundle
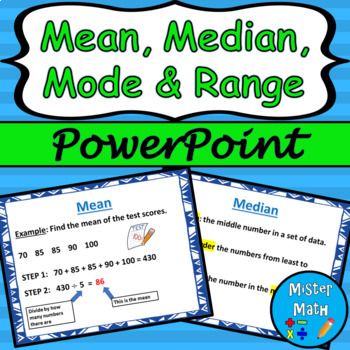
Mean, Median, Mode & Range PowerPoint Lesson
This is a PowerPoint Lesson to assist students in learning about finding the mean, median, mode, and range of data sets. The PowerPoint includes key vocabulary, as well as an example for each skill. Plenty of real-life examples are included to give students ample opportunities to connect the skills to the real world. The presentation also comes fully animated, with animations triggered by mouse click (or presentation pointer!)This PowerPoint lesson is also part of a BUNDLE that includes a guided
Subjects:
Grades:
3rd - 6th
Also included in: Mean, Median, Mode & Range PPT and Guided Notes BUNDLE
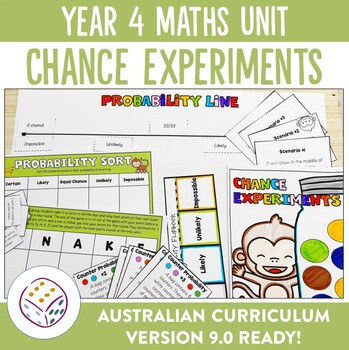
Australian Curriculum 9.0 Year 4 Maths Unit Chance
Explore the concept of chance with this unit plan and activity bundle. Bring your maths lessons to life as the unit plan walks you through everything you need to thoroughly cover the AC9M4P01 and AC9M4P02 elements of the Australian Year 4 Maths curriculum (version 9.0). Fun for students, easy for you to implement and an irresistible way for budding mathematicians to learn about chance experiments and outcomes!Bring the fun back into learning about probability as you guide your students through t
Subjects:
Grades:
3rd - 5th
Also included in: Ultimate Australian Curriculum 9.0 Year 4 Units Bundle
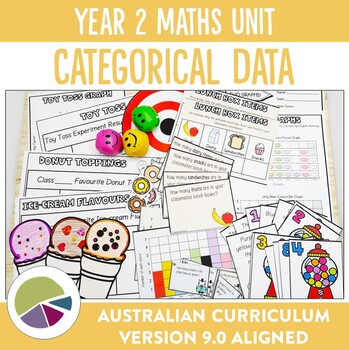
Australian Curriculum 9.0 Year 2 Maths Unit Data
Help your students collect data and interpret graphs with this unit plan and activity bundle. Bring your maths lessons to life as the unit plan walks you through everything you need to thoroughly cover the AC9M2ST01 and AC9M2ST02 elements of the Australian Year 2 Maths curriculum (version 9.0). Fun for students, easy for you to implement and an irresistible way to help budding mathematicians explore data.Bring the fun back into learning about data as you guide your students through the followin
Subjects:
Grades:
1st - 3rd
Also included in: Ultimate Australian Curriculum 9.0 Year 2 Units Bundle
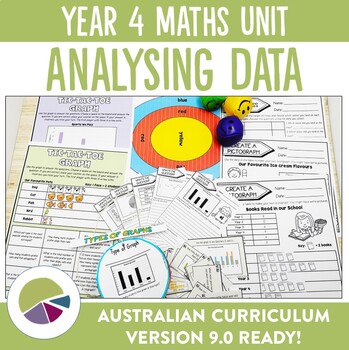
Australian Curriculum 9.0 Year 4 Maths Unit Data
Explore types of data and graphs with this unit plan and activity bundle. Bring your maths lessons to life as the unit plan walks you through everything you need to thoroughly cover the AC9M4ST01, AC9M4ST02 and AC9M4ST03 elements of the Australian Year 4 Maths curriculum (version 9.0). Fun for students, easy for you to implement and an irresistible way for budding mathematicians to learn about statistical data and representation!Bring the fun back into learning about data as you guide your stude
Subjects:
Grades:
3rd - 5th
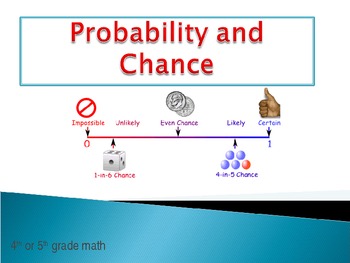
Probability and Chance Powerpoint using candy, dice, spinners and more
Probability and Chance:
This Powerpoint includes definitions, examples, descriptions, and multiple choice questions.
It also includes slides for guided practice using M&Ms.
Subjects:
Grades:
3rd - 6th
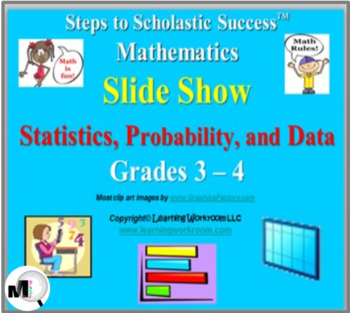
Statistics, Probability, and Data Slide Show for Grades 3 and 4
The vocabulary and concepts included are sets, data, survey, tally, charts, diagrams, graphs, key, mean, probability, combinations, and tree diagrams.The 49 PowerPoint slides are a combination of teaching (lecture style) and interactive slides (matching, fill-in, multiple choice, etc).Also included is a Directions Page for using PowerPoint and for using the PEN OPTION of PowerPoint.The Preview File is pages 1-11 of the Slide Show so that you can "Try before you Buy".~~~~~~~~~~~~~~~~~~~~~~~~~~~~~
Subjects:
Grades:
3rd - 4th
Also included in: Math for Grades 3-4 PowerPoint Slide Show BUNDLE Math Vocabulary
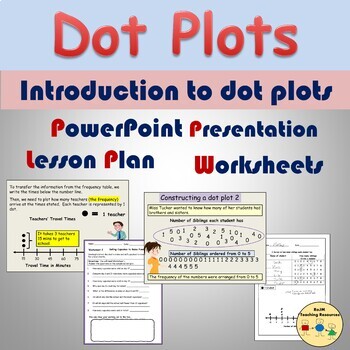
Dot Plots Line Plots Worksheets Presentation Frequency Tables Statistics
This resource relates to statistics on the topic of dot plots. It introduces dot plots on PowerPoint (12 Slides). The presentation demonstrates how the data was collected, rearranging data in numerical order, and presenting the data on a frequency table. Using the information on the frequency table, students are shown how to create a dot plot/line plot via Slide Show animation. Two detailed examples are shown. Content:· PowerPoint Presentation (12 Slides)· 1 Flexible Lesson Plan (1- 2 hrs)· 2 Se
Subjects:
Grades:
3rd - 5th
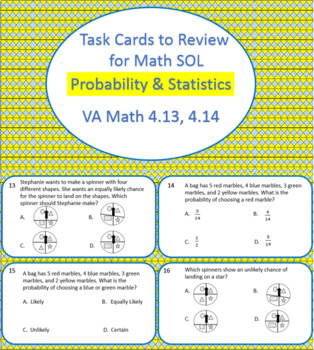
28 Task Cards to Review Probability & Statistics for 4th Grade Math SOL 2016 SOL
28 cards to review the Probability & Statistic questions often seen on the Virginia math SOL. These questions were written with similar sentence stems with the same type of rigor. These are aligned with the 2016 Standards of Learning (SOL). Students can master these concepts with a bit of practice with the testing language. Task cards break up the monotony of test prep by being used in a variety of different ways.You could pass out a few to each student at a time and when they are finished h
Subjects:
Grades:
3rd - 5th
Types:
Graphing & Probability Jeopardy Review Game
A fun and exciting way for students to review Graphs, Probability, and Combinations/Outcomes. This game is similar to a Jeopardy Game where students will answer the questions to earn points! This game puts a little twist on regular Jeopardy by turning it into what I call "Jailbreak Jeopardy". The students must work to answer the questions before the Math Thief gets away! The team with the most points, puts the Math Thief back in jail and wins the reward! (I usually provide students with a math p
Subjects:
Grades:
2nd - 4th
Also included in: Jailbreak Jeopardy Bundle
Fun with Probability Powerpoint Presentation
This fun powerpoint presentation presents and defines probability in clear terms that are easy for students to understand.
Includes three full class practice example questions, and two pair-work practice problems with three questions each.
This item is included in my Fun with Probability Lesson Pack.
Though my district begins probability in 4th grade right now, it is not covered in Common Core until 7th grade. The NCTM standards begin probability in 3rd-5th, so I have listed the grade range a
Subjects:
Grades:
3rd - 7th
Types:
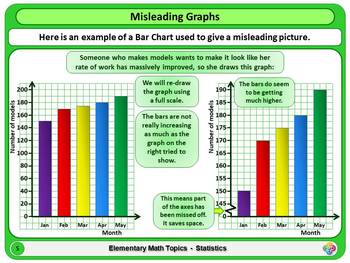
Misleading Graphs for Elementary School Math Powerpoint
A short Powerpoint Presentation to explain misleading graphs.This powerpoint has a title and end slide, as well as the number of slides stated above.You may prefer to purchase this product as part of one of the following two Bundles, which are both available from my shop on this site and offer excellent value:"Elementary School Math Topics: Statistics" (10 powerpoints)"Elementary School Math Topics: The Full Set". (88 Powerpoints)
Subjects:
Grades:
2nd - 5th
Types:
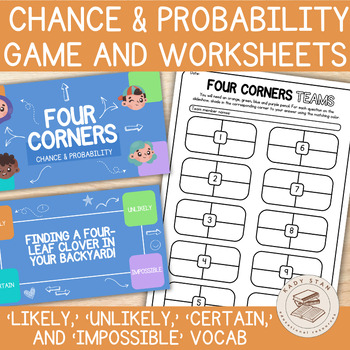
Chance and Probability Game | Slideshow Activity & Worksheets | 2nd Grade Maths
*Topic: Chance and Probability exploring the vocabulary of likely, unlikely, certain, and impossible* Our reimagined Four Corners is a dynamic classroom game where students respond to questions posed by the teacher by physically moving to one of four corners in the room, each representing a different answer option. It's a fun and interactive way to engage students whilst they learn, and you assess their understanding of the topic. THREE WAYS TO PLAY: Traditional Four CornersUtilise a digital de
Subjects:
Grades:
1st - 3rd
Probability: Direct Instruction - VA SOL 3.14
The product provides 5 days of Direct Instruction for Probability, SOL 3.14. Included is 2 days of animated Google Teaching Slides and 3 days of Nearpod Instructional Slides. The Nearpod links are accessed on Days 3, 4 and 5 of the Google slides by clicking on the Nearpod Logo!Day 1 - Defining Probability, Identifying and Using Probability Terms Day 2 - Defining Probability, Identifying and Using Probability Terms Day 3 - Identifying and Using Probability Terms, Filling in Models to Show Probabi
Subjects:
Grades:
3rd - 4th
Types:
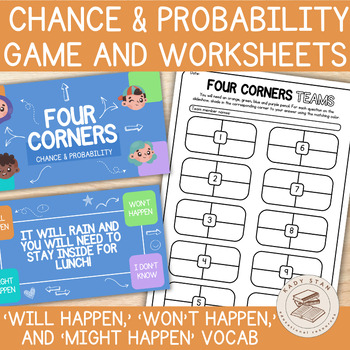
Chance and Probability Game | Slideshow Activity & Worksheets | 1st Grade Maths
*Topic: Chance and Probability exploring the vocabulary of will happen, won’t happen, and might happen* Our reimagined Four Corners is a dynamic classroom game where students respond to questions posed by the teacher by physically moving to one of four corners in the room, each representing a different answer option. It's a fun and interactive way to engage students whilst they learn, and you assess their understanding of the topic. THREE WAYS TO PLAY: Traditional Four CornersUtilise a digital
Subjects:
Grades:
1st - 3rd
Data Slides Bundle
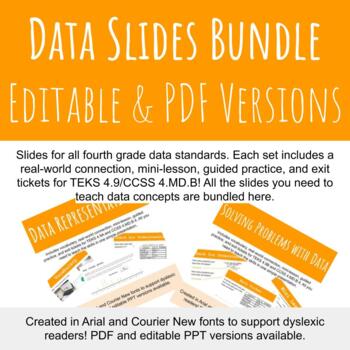
This is a bundle of two slideshows to introduce data concepts to your students (TEKS 4.9/CCSS 4.MD.B). Two skills are included:-Data representations (4.9A and B/4.MD.B.4)-Solving multi-step problems using data (4.9B/4.MD.B.4)This is a great deal for all of TEKS in unit 7/CCSS units on data. PowerPoints and PDFs are also available individually if you'd prefer to purchase each standard separately. This bundle helps you save as it includes both the editable PPT and non-editable PDF versions of all
Subjects:
Grades:
3rd - 5th
CCSS:
Unit 5 – Questions can be asked and answered by collecting and intepreting data
Accompanying slides for the Stage 2 NSW Mathematics unit- Unit 5 – Questions can be asked and answered by collecting and interpreting data.Contains 124 slides with lesson steps and teacher notes.
Subjects:
Grades:
3rd - 4th
Elementary School Math Topics: STATISTICS & PROBABILITY
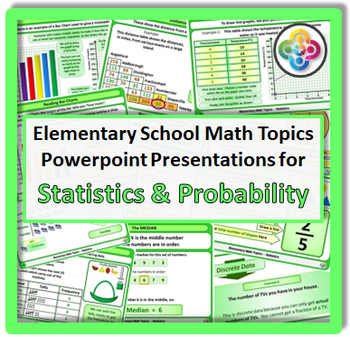
This set of 10 powerpoint presentations, covering topics in "Statistics and Probability" is from the product ""Elementary School Math Topics: The Full Set". (88 Powerpoints). You may prefer to buy this complete set, which is available from my shop on this website and is excellent value.The presentations included here (all of which can be purchased individually) are:Bar ChartsDistance TablesLine GraphsMisleading GraphsMode, Median, Mean and RangePictogramsPie ChartsProbabilityTally ChartsTypes of
Subjects:
Grades:
2nd - 5th
Types:
Measurement and Data Common Core Math Vocabulary Posters- Grade 3
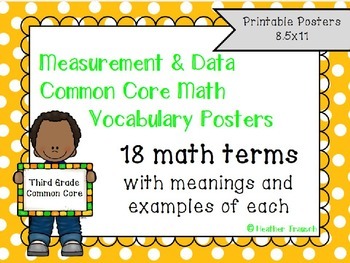
Common Core Math Vocabulary posters aligned with all Measurement & Data (3.MD) skills for Third Grade Math Common Core instruction. Includes 18 math terms, meanings and examples for each.
Terms included in this pack: area, bar graph, dimension, elapsed time, gram, hour, minute, kilogram, length, line plot, liquid volume, liter, mass, perimeter, pictograph, second, square unit, and width.
Please see my store for poster sets in each of the 4 other Common Core Math Strands for Third Grade! O
Subjects:
Grades:
3rd
Types:
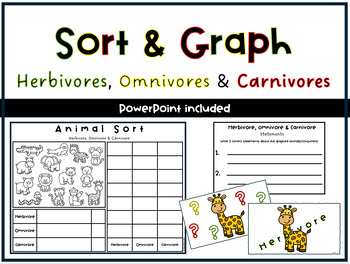
Sorting and Graphing- Herbivores, Omnivores & Carnivores
Combine Science and Maths with this graphing activity!Learn which category each animal falls unders (herbivore, omnivore or carnivore) and display your findings using tally marks and a bar graph. Then make 2 correct statements about what you graph is showing. A PowerPoint is included for the teacher to use and create more class discussion.
Subjects:
Grades:
K - 3rd
Data Representation Powerpoint
The presentation contains: 1) TALLY MARKS Learning Objectives. Definition of a tally mark. Uses of tally mark. How to count a tally mark. Tally Mark Chart. Construction of a tally mark table with an example. Application on real life problems on tally mark. Read and Interpret a tally mark table.The presentation contains: 2) FREQUENCY DISTRIBUTION TABLEDefinition of a Frequency Distribution Table. Types of Frequency Distribution Table: a) Discrete Frequency Distribution Table (Ungrouped).b) C
Subjects:
Grades:
1st - 10th, Higher Education, Staff
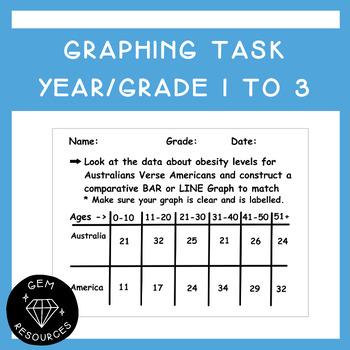
Graphing Assessment/Activity - Year/Grade 1 to 3 Data Statistics Maths
Students are required to:- create a comparative line or bar graph- show appropriate labelling to their graph- make statements about the data- make predictions based off the data- pose further questions in relation to the data for real world scenariosThis document is a PowerPoint.
Subjects:
Grades:
1st - 3rd
Showing 1-24 of 83 results


