27 results
Not grade specific statistics resources for Microsoft PowerPoint
Intro to Data Analysis Interactive Lesson *Any Level* Mean, Median, Mode & Range
Are you introducing your students to concepts like data sets, mean, median, and mode?Do you want your students to actually understand the meaning of these terms, not just see them as meaningless, unimportant, abstract words in a math textbook?Do you want your students to understand that calculating mean, median, mode, and range is actually useful, not just pointless math exercises?This may be the perfect lesson for you!This lesson is fully complete and ready to use, based on well-researched peda
Subjects:
Grades:
Not Grade Specific

Guerre des clans!
Plongez-vous dans l'excitation d'un jeu télévisé avec cette adaptation palpitante du célèbre Duel de Questions ! Dans ce jeu interactif, deux équipes s'affrontent pour trouver les réponses les plus populaires à une série de sondages. Vous recevrez un fichier PowerPoint contenant 25 sondages, chacun présenté sous forme de rectangles bleus à cliquer pour révéler les réponses. ATTENTION! Assurez-vous d'avoir les feuilles de réponses des sondages à portée de main pour ouvrir les bonnes cases !Règles
Subjects:
Grades:
Not Grade Specific
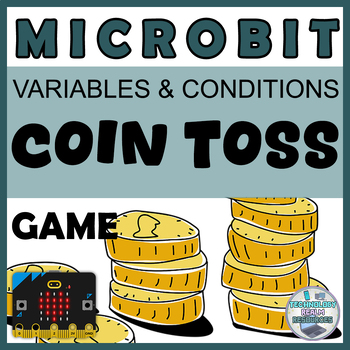
Microbit BEGINNER Coin toss project variables and conditions coding
This resource is about the popular coin toss game and how the students, with the help of a little microbit block coding (variables, conditions, comparators, random numbers, on button press event), can recreate the game and enjoy their time while learning.The Micro:bit circuit board is nothing without some fun activities and games that show how cool programming and coding can be! This is exactly why I am here - to help educators all around the world in their quest for fun Micro:bit activities and
Grades:
Not Grade Specific

Critical Thinking | Inductive Arguments + Statistics (PPT)
This Editable Presentation includes:✓ 28 Animated PowerPoint Slides✓ Clear + Organized + Accessible ContentTopics: “Inductive Arguments & Statistics” [FREE READING]ENUMERATIVE INDUCTION Sample Size Representativeness OPINION POLLS ANALOGICAL INDUCTION (arguments by analogy)Relevant Similarities Relevant Dissimilarities The Number of Instances Compared Diversity Among CasesPractice ExamplesGamblers Fallacy + Other Inductive FallaciesRebeka Ferreira's Content:✓ Like & Subscribe on YouTube✓
Grades:
Not Grade Specific
Also included in: Critical Thinking (COMPLETE - PPT Bundle)
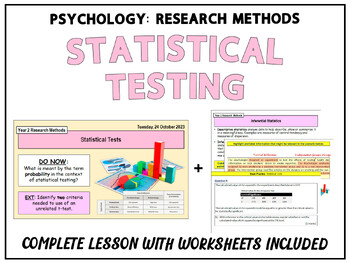
RESEARCH METHODS IN PSYCHOLOGY: Statistical Testing
To request lessons, provide feedback or if you have had any issues opening any resources of my resources, please feel free to contact me on jb_resources@outlook.com (responses are usually very prompt).Key content covered in this Lesson:Key QuestionsDescriptive vs. Inferential StatisticsInferential Statistics in PsychologyStatistical Tests: Wilcoxon, Related t-test, Chi-squared, Mann Whitney, Unrelated t-test, Spearman's Rho, Pearons rLearning the Decision TreeWhen to Use Parametric TestsStatisti
Subjects:
Grades:
Not Grade Specific
Also included in: RESEARCH METHODS IN PSYCHOLOGY [UNIT 2 COMPLETE MODULE]
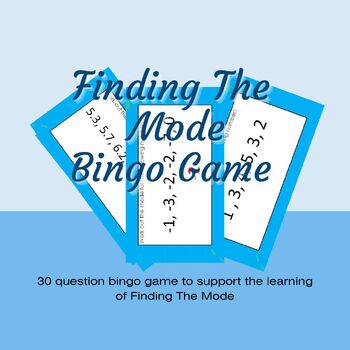
Finding The Mode Maths Bingo Game Activity
OverviewFinding The Mode Maths Bingo Game is an engaging PowerPoint downloadable game/activity designed to help students revise the math topic of finding the mode from a set of data. With 30 adaptable questions and answers included, this game encourages active participation and critical thinking. Students pick 9 numbers at the beginning, and the teacher projects the PowerPoint game, creating an interactive and enjoyable revision session.PowerPoint StructureSlide 2 Table of 30 Answers A table fea
Subjects:
Grades:
Not Grade Specific
Univariate Stats: Frequency Distribution Table, Animated PPT w/ Scaffolded Notes
This Univariate Stats: Frequency Distribution Table resource contains scaffolded note pages that correspond to an interactive PowerPoint for your scientific method or statistics unit. There is a Tip & Tricks slide and corresponding note page that compiles feedback, notes, and helpful information I have personally seen benefit my students.Please be aware that this lesson was designed for a criminal justice-based statistics course; as such, topics and applied word problems use related themes.P
Subjects:
Grades:
Not Grade Specific
CCSS:
NGSS:
HS-LS4-3

Data Handling: Traffic Nightmare Tally and Bar Charts Project
A fantastic and very comprehensive resource including a Traffic Nightmare project book, lesson plan, student objective sheets, PowerPoint extended data collection exercise, PowerPoint Tally Chart Bingo, student bingo sheet and a PowerPoint introduction to using tally charts.
This project focuses on a scenario where the opening of a local supermarket has resulted in a great increase in heavy traffic through a residential area. The students tally the vehicles they see on screen to 'prove' the incr
Subjects:
Grades:
Not Grade Specific

Constants, Variables, & Level of Measurement Animated PPT w/ Scaffolded Notes
This constants, variables, and level of measurement resource contains an interactive and animated PowerPoint with matching scaffolded style notes for your scientific method or statistics unit. There is a Tip & Tricks slide and corresponding note page that compiles feedback, notes, and helpful information I have personally seen benefit my students.Please be aware that this lesson was designed for a criminal justice-based statistics course; as such, topics and applied word problems use related
Subjects:
Grades:
Not Grade Specific
CCSS:
NGSS:
HS-LS3-3
Univariate Stats: Frequency Distribution Table, Animated PPW & Knowledge Checks
This Univariate Statistics: Frequency Distribution Table resource contains an interactive and animated PowerPoint for your scientific method or statistics unit. You can also purchase the matching scaffolded notes. There is a Tip & Tricks slide and corresponding note page that compiles feedback, notes, and helpful information I have personally seen benefit my students.Please be aware that this lesson was designed for a criminal justice-based statistics course; as such, topics and applied word
Subjects:
Grades:
Not Grade Specific
CCSS:
NGSS:
MS-LS4-6
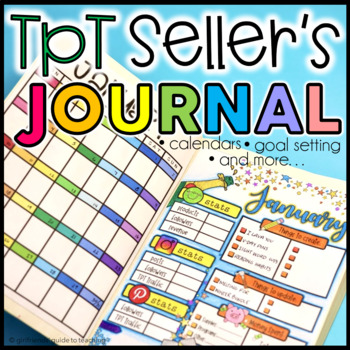
TpT Seller's Journal I Calendars and Monthly Planning
This monthly planner or BULLET JOURNAL is intended to help TpT sellers or ANY SELLER by recording and tracking stats and helping them organize and set goals for each month of the year! This file has a bullet journal style format with fun illustrations and designs for each month of the year. This file also comes with editable pages to create the journal page that best fits your needs.NOTE: There is a PREVIEW available for this file. Please, take a look and see if this activity is a good fit for y
Subjects:
Grades:
Not Grade Specific

Constants, Variables, & Level of Measurement Animated PPW, Knowledge Checks
This constants, variables, and level of measurement resource contains an interactive and animated PowerPoint for your scientific method or statistics unit. You can also purchase the matching scaffolded notes. There is a Tip & Tricks slide and corresponding note page that compiles feedback, notes, and helpful information I have personally seen benefit my students.Please be aware that this lesson was designed for a criminal justice-based statistics course; as such, topics and applied word prob
Subjects:
Grades:
Not Grade Specific
CCSS:
NGSS:
HS-LS3-3

Independent Variables, Dependent Variables, & Contingency Tables, Animated PPW
This Independent Variables, Dependent Variables, & Contingency Tables resource contains an interactive and animated PowerPoint for your scientific method or statistics unit. You can also purchase the matching scaffolded notes. There is a Tip & Tricks slide and corresponding note page that compiles feedback, notes, and helpful information I have personally seen benefit my students.Please be aware that this lesson was designed for a criminal justice-based statistics course; as such, topics
Subjects:
Grades:
Not Grade Specific
CCSS:
NGSS:
MS-PS3-4
, 5-PS1-3
, 5-PS1-4
, HS-PS3-4
, HS-PS2-5
...

Class Birthday Display - Native New Zealand Tree
Do your kids struggle with getting the months of the year in order? In English? In Te Reo? Do they know when their birthday is? Are you setting up a birthday display in your classroom?This display will help your kids to get their months in order and know when their and their friends birthdays are. Simply print off the months and the number of matching date circles you need for each month, laminate and add their names and birthdays on and your ready to go! This stunning selection of Native New Z
Subjects:
Grades:
Not Grade Specific
Types:
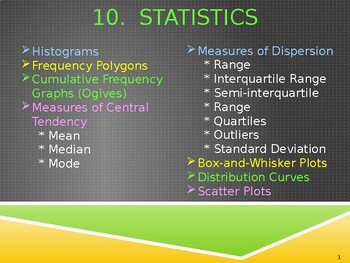
Grade 11 Maths: Statistics in PowerPoint
Histograms, frequency polygons, cumulative frequencies, graphs, measures of central tendency - mean, median & mode, measures of dispersion, box-and-whisker plots, distribution curves, scatter plots, explanations, examples and exercises. Excellent for classroom teaching with a data projector & use on mobiles.
Subjects:
Grades:
10th - 12th, Not Grade Specific
Also included in: G 11 Maths: Statistics, finance growth and decay in animated PowerPoint.

Fun Friday Polls (Food)
Do you do Fun Friday activities? These polls are based upon some of kids favorite foods and resturants. Countless opportunities with this activity from ice-breakers to incorporating a math lesson with percents and fractions.
Subjects:
Grades:
Not Grade Specific
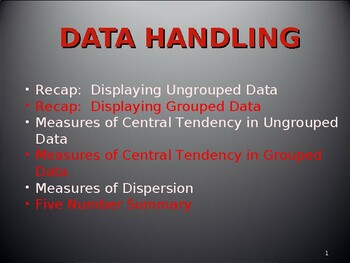
Grade 10 Maths: Statistics in PowerPoint.
Displaying ungrouped data, displaying grouped data, measures of central tendency in ungrouped data, measure of central tendency in grouped data, measures of dispersion, five number summary, examples & exercises. Excellent for classroom teaching & for use on mobiles.
Subjects:
Grades:
9th - 11th, Not Grade Specific
Also included in: G 10 Maths Statistics and probability in animated PowerPoint.
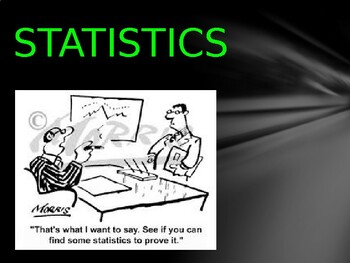
Grade 12 Statistics in PowerPoint
Measures of central tendency & spread, five-number summary, distribution data & curve, skewed to the right distribution & curve, scatter plots with positive negative and no correlation, least squares regression line, predictions using the line of best fit, correlations, interpreting correlation coefficient, positive strong correlation, negative & weak correlation, no correlation. Excellent for classroom teaching with a data projector and also can be used on a mobile phone.
Subjects:
Grades:
11th - 12th, Not Grade Specific
Also included in: G 12 Maths: Statistics, counting and probability in animated PowerPoint.
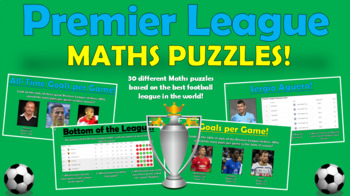
Premier League Maths Puzzles (Puzzles for Soccer Lovers!)
These short and snappy puzzles are perfect for engaging all of the football lovers in your class in a wide range of maths problems! Using real-life statistics from the English Premier League, students approach a number of varied maths topics, whilst also gaining valuable information about their favourite teams and players. I have used these resources with a number of KS2 and KS3 classes, and have always found that students find them extremely interesting and informative.
Some of the maths topic
Subjects:
Grades:
Not Grade Specific
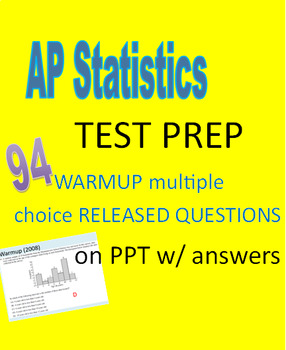
AP Statistics Test Prep Warmup Questions (94 Released Test ?s, w/ Answers)
94 slides of released test questions for warmup use for AP Statistics. Answers on each slide. Most also have test year the question came from. Great for spiral review and daily warmup/test taking strategy practice.All questions copyright Collegeboard.com
Subjects:
Grades:
Not Grade Specific
Types:

A begginers guide to SEO for blogs and websites.
This is a blueprint of a beginner's guide to SEO for websites and blogs - parts one and two. This is what we followed for our www.tourandtakein.com.Thus giving us a great domain authority score on articles and the site as per attachedThis enables your articles to reach the top pages in most search engines, thus increasing traffic and a bigger audience. We aim for the top ten pages of Google!More parts to follow, email us if you need more before we publish..
Grades:
Not Grade Specific
At the Movies... Data Math -Mean
You may use this lesson as a review or practice with Data and statistics. Go over the Academic Vocabulary words that will be used in this lesson.Meanoutlier Cluster GapThe students are movie theater owners and have three screens. They will create a logo for their theater. Then they will be given famous movies that were block busters and decide which to show. The excitement builds to see if they chose the biggest blockbuster of the week and are able to beat the class.
Subjects:
Grades:
Not Grade Specific
Types:

COMPETITIVE MARKET EQUILIBRIUM
Competitive Market Equilibrium, Consumer surplus, Producer surplus and Deadweight Loss in finger Tips
Subjects:
Grades:
Not Grade Specific
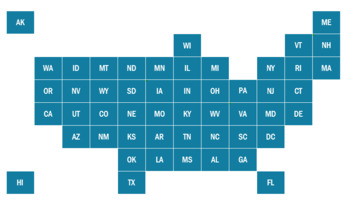
USA Tile Map Template for Microsoft Excel - Data Visualization
Editable Excel tile grid maps of the United States. Workbook includes four different map versions. Enter your own data and use the maps as they are, or customize fonts, text, and colors per your own style guidelines. Versions include 1) USA Heatmap with values as percents 2) USA Heatmap with values as counts 3) USA solid tile map with state labels 4) USA sold map with state labels and StateFace font icons (Note StateFace font can be downloaded free at www.fontsquirrel.com).Once you've entered yo
Subjects:
Grades:
Not Grade Specific
Showing 1-24 of 27 results


