18 results
Adult education statistics interactive whiteboards
6th Grade Statistics & Data 5 - Box and Whisker Plot Powerpoint Lesson
Sixth Grade Statistics 5 - Box and Whisker Plot Powerpoint Lesson is powerful when used as direct instruction in the classroom, online or individually. It teaches students all the skills necessary to make a box and whisker plot: mean, median, lower quartile Q1, upper quartile Q3, inter quartile range, range, minimum and maximum numbers. Students then are shown how to take this information and build a box and whisker plot. Finally, students are taught how to analyze the box and whisker plot th
Subjects:
Grades:
6th, Adult Education
Also included in: 6th Grade Statistics & Data Bundle - 6 Powerpoint Lessons - 402 Slides
6th Grade Statistics & Data 1 - Statistical Questions & Types of Data Lesson
Sixth Grade Statistics 1 - Statistical Questions and Types of Data Powerpoint Lesson is powerful when used as direct instruction in the classroom, online, or individually. It teaches students how to recognize and pose a statistical question. Students also learn the difference between numerical and categorical data. They also learn the 4 basic steps in presenting data: posing a statistical question, gathering the data, displaying the data, and answering the question they posed. There are 22
Subjects:
Grades:
6th, Adult Education
CCSS:
Also included in: 6th Grade Statistics & Data Bundle - 6 Powerpoint Lessons - 402 Slides
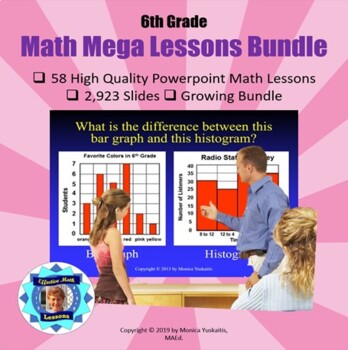
6th Grade Powerpoint Mega Math Bundle - 58 Lessons - 2923 Slides
Sixth Grade Powerpoint Math Bundle is composed of 58 different high quality math powerpoint lessons comprising 2,923 slides. These are perfect for distance learning on Zoom or similar formats. On top of that they are powerful when used as direct instruction in the classroom.There are 22 strategies of effective teaching based on research in these powerpoint lessons. . For further information on each lesson click on them individually. This is a growing bundle which means as new products are a
Subjects:
Grades:
6th, Adult Education
6th Grade Statistics & Data 6 - Mean Absolute Deviation Powerpoint Lesson
Sixth Grade Statistics 6 - Mean Absolute Deviation Powerpoint Lesson is powerful when used as direct instruction in the classroom, online or individually. It teaches students the steps to take to find the Mean Absolute Deviation of a set of data. The skills necessary to do this task are reviewed: how to find the mean, how to find absolute values of numbers, and how to add and subtract integers. There are 22 effective teaching strategies based on research used in this lesson. For best resul
Subjects:
Grades:
6th, Adult Education
Also included in: 6th Grade Statistics & Data Bundle - 6 Powerpoint Lessons - 402 Slides
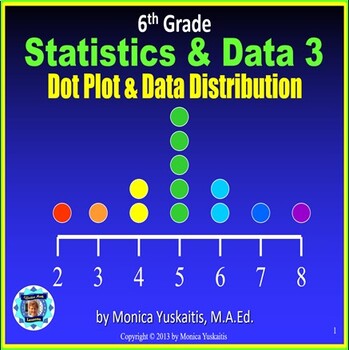
6th Grade Statistics & Data 3 - Dot Plot and Data Distribution Powerpoint Lesson
Sixth Grade Statistics 3 - Dot Plot and Data Distributions Powerpoint Lesson - is powerful when used as direct instruction in the classroom, online, or individually. It teaches students how to read and create dot plots. In addition, students learn to analyze the data as to its center, spread, and most common numbers. There are 22 strategies of effective teaching based on research. For best results, students should have white boards and dry erase markers. For instructions on how to successf
Subjects:
Grades:
6th, Adult Education
CCSS:
Also included in: 6th Grade Statistics & Data Bundle - 6 Powerpoint Lessons - 402 Slides
6th Grade Statistics & Data 2 - Mean, Median, Mode & Range Powerpoint Lesson
Sixth Grade Statistics 2 - Mean, Median, Mode and Range Powerpoint Lesson is powerful when used as direct instruction in the classroom, online, or individually. It teaches students how to find the mean, median, mode and range in a group of statistics. There are 22 effective teaching strategies based on research used in this lesson. For best results, students should have white boards and dry erase markers. For instructions on how to successfully use this powerpoint math lesson click here.
Subjects:
Grades:
6th, Adult Education
Also included in: 6th Grade Statistics & Data Bundle - 6 Powerpoint Lessons - 402 Slides
Fundamental Counting Principle and Probability Powerpoint
This 22 slide powerpoint is a great way to teach Tree Diagrams, The Fundamental Counting Principle, and Probability to your Middle Schools Students. It can be used with a smartboard to get your students active and involved or without a smartboard.
Subjects:
Grades:
6th - 8th, Adult Education
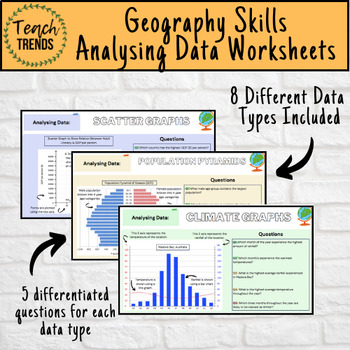
Geography Data Analysis Skills Work Booklet / Activities
Enhance your pupils’ geographical skills with a series of interpretation and analysis sheets and questions. This resource includes 8 PDF slides with corresponding questions all focused on a different data presentation method. Ideal for preparing your pupils for exams and revising analysis skills. The high quality slides include annotations, examples and five scaled-ability questions.The data presentation skills included in this resource are:Climate GraphsPopulation PyramidsChoropleth MapsScatter
Subjects:
Grades:
8th - 12th, Adult Education
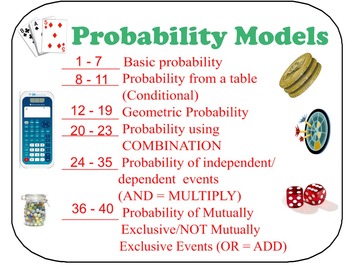
BUNDLE *** FCP, Perm, Comb, & Probability Models Lessons & Exit Ticket
BUNDLE of:
Exit Ticket on FCP, Permutation, & Combination
FCP, Permutation, and Combination - PDF 36 problems
FCP, Permutation, and Combination - Smart Notebook 36 problems
Probability Models - Power Point illustrated models
Probability Models - PDF 40 questions
Probability Models - Smart Notebook 40 questions
Visual Representation of Standard Deck of Cards
For more details, please check the individual description of those items.
Separately, these would cost more than $12.99
☺Would love
Subjects:
Grades:
6th - 12th, Higher Education, Adult Education
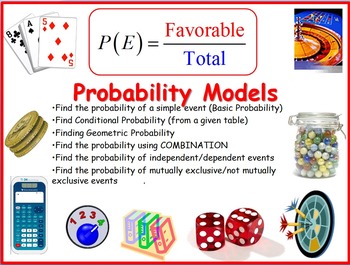
Probability Models
This handout drills the understanding of the different models of probability. Student would have to first determine under which model should this problem fit, then, apply the appropriate strategy to answer the questions. There are many ways to answer each of the questions provided in this handout. I provided "An" answer key.
In this handout, you will find a set of 40 questions on the following probability models:
1. Detailed visual description of the Standard Deck of Cards
2. Basic Probab
Subjects:
Grades:
6th - 12th, Higher Education, Adult Education, Staff
Statistics PowerPoints - Frequency Histograms Polygons Scatter Regression Normal
Titles include Frequency Histograms and Polygons, Collecting and Displaying Data, Capture Recapture, Scatter Plots, Regression Lines and the Normal Distribution. Demonstrating statistical concepts with pen or chalk can be difficult, leaving many students confused. A much more effective method is to switch on your whiteboard or projector and use quality PowerPoint presentations to take students through the processes step-by-step, point-by-point.60 slides.
Subjects:
Grades:
7th - 10th, Adult Education
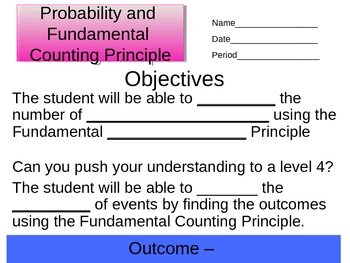
Fundamental Counting Principle and Probability Student Notes Powerpoint
This 18 slide powerpoint goes with my Fundamental Counting Principle, and Probability Powerpoint. You can print a handout of these slides with the blanked out key information for students to use to take notes as they follow along with the presentation.
Subjects:
Grades:
6th - 8th, Adult Education
Interactive Math: Slope and Slope Intercept Form
This is a must have for students in your Algebra class. The fun and engaging slideshow will give students an assessment of their skills in slope-intercept form. Students who struggle with the concept will be given tips for each incorrect answer and when to graphing equation.Types of questions include:Identifying slope and interceptTransforming equations into both standard and slope-intercept form.Identifying equation fro graph.Graphing linear equations in slope-intercept form.The zip file includ
Subjects:
Grades:
8th - 10th, Adult Education
CCSS:
SMARTBOARD lesson on ratios, fractions, percentages, and more
This smartboard lesson showcases how ratios, fractions, decimals, probabilities, and percentages are all similar ways of looking at the same thing. Each page has a spinner with a different amount of colored slices on it. As you go from many slices to fewer slices, the chance of correctly predicting what color comes up gets much better.
Have students 'bet' classroom rewards like tickets or candy to see who can correctly guess the most colors as you go through the lesson.
Subjects:
Grades:
3rd - 12th, Adult Education
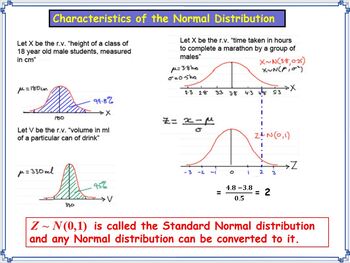
The Normal Distribution (Standardising and using Statistical Tables)
Working out probabilities using Normal Distribution (Standardising and using Statistical Tables) - Fully planned interactive lesson with step by step guide on how to standardise and use Standard Normal Distribution Statistical Tables in a variety of context.
Subjects:
Grades:
10th - 12th, Higher Education, Adult Education, Staff

Fundamental Counting Principle and Probability Printout Copy Powerpoint
This 21 slide powerpoint goes with my Fundamental Counting Principle, and Probability Powerpoint. You can print a handout of these slides for students to use to highlight key information as they follow along with the presentation. This PPT is a great way to keep your struggling students on your pace and make sure that they have a complete copy of your presentation to look back on when they need it.
Subjects:
Grades:
6th - 8th, Adult Education
Hypothesis Testing (Binomial) + Type I-II errors
A levels Statistics Hypothesis Testing (Binomial) + Type I-II errors
Subjects:
Grades:
8th - 12th, Higher Education, Adult Education
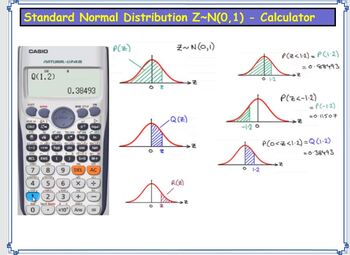
The Normal Distribution (Using Calculators)
Finding probabilities using Normal Distribution (Calculator)
Subjects:
Grades:
9th - 12th, Higher Education, Adult Education
Showing 1-18 of 18 results


