57 results
Adult education graphing interactive whiteboards
3rd Grade Math Jeopardy Game - Measurement and Data 3.MD.4 with Google Slides
Third Grade Common Core Math Jeopardy Game - 3 MD.4 Measurement and Data 3.MD.4 Practice provides two ways for students to practice and show mastery of their Measurement and Data skills. Jeopardy board includes 25 distinct problems and utilizes hyperlinks to award/deduct money from your student teams! (79 slides in all!) Board is automatically updated to show which questions have already been utilized. Also includes an Answer Key if you wish to use questions as Quiz/Test. The PowerPoint file can
Subjects:
Grades:
3rd, Adult Education
CCSS:
6th Grade - Coordinate Plane Powerpoint Lesson
6th Grade Coordinate Plane - This is perfect for distance learning on Zoom or similar formats. On top of that it is powerful when used as direct instruction in the classroom. It teaches students how to locate and name points in the coordinate plane in all 4 quadrants. In addition, they learn the terms and concepts of grid, coordinate plane, x axis, y axis, coordinate pair and rules governing the placement of plots. There are 22 effective teaching strategies based on research used in this le
Subjects:
Grades:
6th, Adult Education
Also included in: 6th Grade Powerpoint Mega Math Bundle - 58 Lessons - 2923 Slides
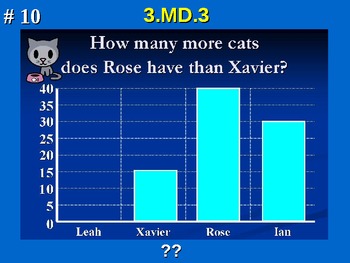
3rd Grade Common Core Math 3.MD.3 Measurement and Data
Third Grade Common Core Math 3 MD.3 Measurement and Data Practice provides two ways for students to practice and show mastery of their measurement skills.
It includes 40 distinct problems in two sets (129 slides in all!), with and without following answer slides. The PowerPoint file can be used on computers, or Promethean and Smart boards.
Take a look at the preview file and buy today for your students benefit!
3.MD.3 Represent and interpret data.
3. Draw a scaled picture graph and a scal
Subjects:
Grades:
3rd, Adult Education
CCSS:
Also included in: 3.MD.3 3rd Grade Math - Draw Scaled Picture & Bar Graph Bundle w/ Google
6th Grade Statistics & Data 1 - Statistical Questions & Types of Data Lesson
Sixth Grade Statistics 1 - Statistical Questions and Types of Data Powerpoint Lesson is powerful when used as direct instruction in the classroom, online, or individually. It teaches students how to recognize and pose a statistical question. Students also learn the difference between numerical and categorical data. They also learn the 4 basic steps in presenting data: posing a statistical question, gathering the data, displaying the data, and answering the question they posed. There are 22
Subjects:
Grades:
6th, Adult Education
CCSS:
Also included in: 6th Grade Statistics & Data Bundle - 6 Powerpoint Lessons - 402 Slides
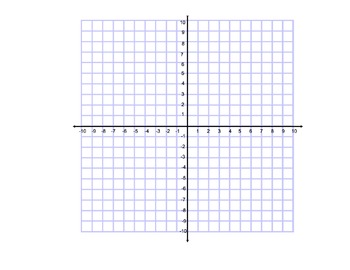
Blank Coordinate Grid
Blank Coordinate grid with all quadrants labeled -10 to 10. Grid is locked in place, though it can be edited. Great for lessons with transformations, or for student who have trouble locating points on a coordinate grid. **Smart Notebook File**Looking for a Google Version? Check out my Google Slides Coordinate Plane for Interactive Notebooks!
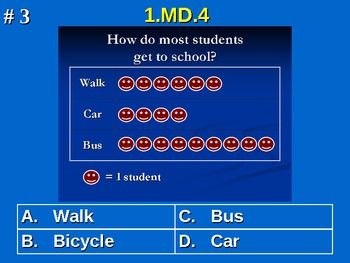
1st Grade Common Core Math 1 MD.4 Interpret Data 1.MD.4
First Grade Common Core Math 1 MD.4 Interpret Data 1.MD.4 Practice provides two ways for students to practice and show mastery of their ability to represent and interpret data.
It includes 40 distinct problems in two sets (129 slides in all!), with and without following answer slides. The PowerPoint file can be used on computers, or Promethean and Smart boards.
Take a look at the preview file and buy today for your students benefit!
Standard 1.MD.4 Represent and interpret data.
4. Organiz
Subjects:
Grades:
1st, Adult Education
CCSS:
Also included in: 1.MD.4 1st Grade Math - Interpret Data Bundle with Google
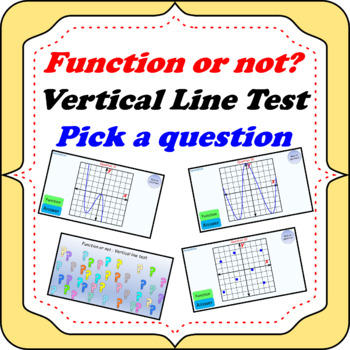
Function or not? Vertical line test. Powerpoint game "Pick a question".
This product contains a PowerPoint with 31 slides. The first slide has 30 question marks.When a question mark is clicked, it goes to a random graph. Students examine the graph and decide if the graph is a function or not.After discussing, they can click on the blue “Answer” button and the graph will be identified as a “function” or “not a function”. If the answer is “not a function”, a straight vertical line will also pass down through the graph, indicating why it is not a function.When the answ
Subjects:
Grades:
9th - 12th, Adult Education
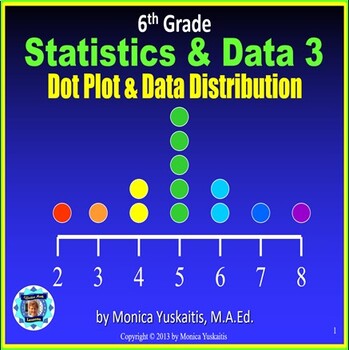
6th Grade Statistics & Data 3 - Dot Plot and Data Distribution Powerpoint Lesson
Sixth Grade Statistics 3 - Dot Plot and Data Distributions Powerpoint Lesson - is powerful when used as direct instruction in the classroom, online, or individually. It teaches students how to read and create dot plots. In addition, students learn to analyze the data as to its center, spread, and most common numbers. There are 22 strategies of effective teaching based on research. For best results, students should have white boards and dry erase markers. For instructions on how to successf
Subjects:
Grades:
6th, Adult Education
CCSS:
Also included in: 6th Grade Statistics & Data Bundle - 6 Powerpoint Lessons - 402 Slides
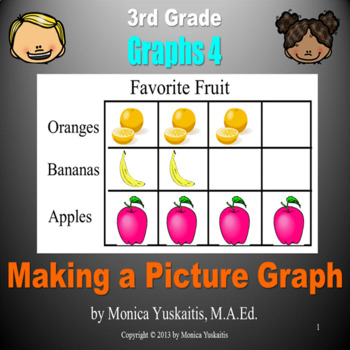
3rd Grade Graphs 4 - Making a Picture Graph Powerpoint Lesson
Third Grade Graphs 4 - Making Picture Graphs - This is perfect for distance learning on Zoom or similar formats. On top of that it is powerful when used as direct instruction in the classroom. It teaches students how to make a picture graph. In addition, the main parts of the picture graph are also taught. The following concepts are reviewed: grid, graph, coordinates, axes, scale, interval, title, and key. There are 22 strategies of effective teaching based on research in this powerpoint les
Subjects:
Grades:
3rd - 4th, Adult Education
CCSS:
Also included in: 3rd Grade Graphs Bundle - 6 Powerpoint Lessons - 277 Slides
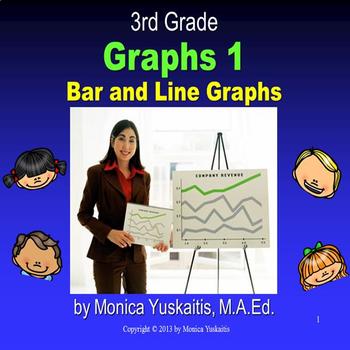
3rd Grade Graphs 1 - Bar & Line Graphs Powerpoint Lesson
Third Grade Graphs 1 - Bar & Line Graphs introduces the students to graphs in general and emphasizes bar and line graphs. This is perfect for distance learning on Zoom or similar formats. On top of that it is powerful when used as direct instruction in the classroom. The following concepts are taught: grid, graph, coordinates, axes, scale, interval, title, key and how to solve problems using a bar or line graph. This lesson is based on 22 principles of effective teaching based on resear
Subjects:
Grades:
3rd - 5th, Adult Education
CCSS:
Also included in: 3rd Grade Graphs Bundle - 6 Powerpoint Lessons - 277 Slides
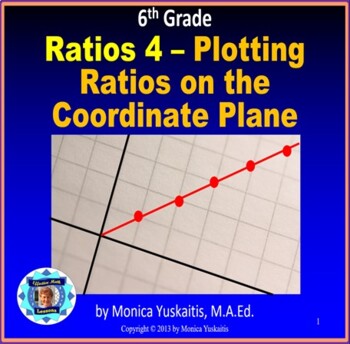
6th Grade Ratios 4 - Plotting Ratios on the Coordinate Plane Powerpoint Lesson
Sixth Grade Ratios 4 - Plotting Ratios on the Coordinate Plane - This is perfect for distance learning on Zoom or similar formats. On top of that it is powerful when used as direct instruction in the classroom. It teaches students how to develop a table of equivalent ratios, write an equation from that information, and then plot the pairs on the coordinate plane. There are 22 effective teaching strategies based on research used in this lesson. For best results, students should have white b
Subjects:
Grades:
6th, Adult Education
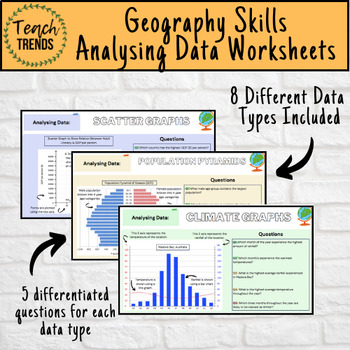
Geography Data Analysis Skills Work Booklet / Activities
Enhance your pupils’ geographical skills with a series of interpretation and analysis sheets and questions. This resource includes 8 PDF slides with corresponding questions all focused on a different data presentation method. Ideal for preparing your pupils for exams and revising analysis skills. The high quality slides include annotations, examples and five scaled-ability questions.The data presentation skills included in this resource are:Climate GraphsPopulation PyramidsChoropleth MapsScatter
Subjects:
Grades:
8th - 12th, Adult Education
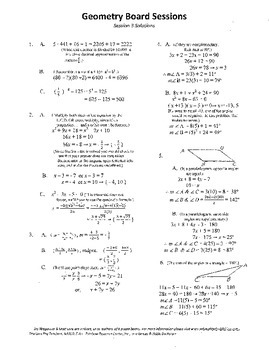
Complete Set 20 Board Geometry Board Sessions,Review WITH Solutions,ACT,SAT
This is the complete set of all 20 Geometry Board Sessions. These twenty sessions will take teacher and student through the entire year of a typical Geometry course at the high school level . . . giving problems that constantly review and blend topics, challenge,"come out " relatively nicely (No calculator is needed.), . . AND each session has a solution sheet with explanations! ( An early aside . . . Though this was NOT their original purpose, any of the twenty sessions included in this pa
Grades:
7th - 11th, Adult Education
CCSS:
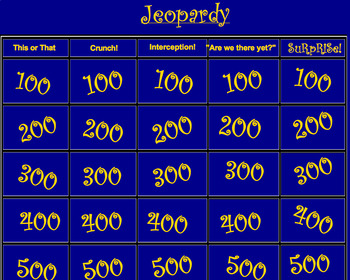
Lines and Slope Jeopardy Review Game
This Jeopardy Smartboard game assesses the following skills
- types of lines (vertical, horizontal, positive and negative slope) and their equation formats
- calculating slope given two points
- finding x and y intercepts
- determining whether or not a point is on a line
About my Products:
While the PARCC assesses many of the mathematical practice standards, I aim to create many problems and activities that require students to apply the skills outlined in the performance level descriptors. I b
Grades:
3rd - 12th, Higher Education, Adult Education, Staff
Types:
3rd Grade Graphs 5 - Line Plots Powerpoint Lesson
Third Grade Graphs 5 - Line Plots - This is perfect for distance learning on Zoom or similar formats. On top of that it is powerful when used as direct instruction in the classroom. It introduces the students to line plots. The following concepts are taught: grid, graph, coordinates, axes, scale, interval, title, and key. There are 22 strategies of effective teaching based on research in this powerpoint lesson. For best results, students should have white boards and dry erase markers. I
Subjects:
Grades:
3rd - 4th, Adult Education
Also included in: 3rd Grade Graphs Bundle - 6 Powerpoint Lessons - 277 Slides
4th Grade Graphs - Making Line Plots Powerpoint Lesson
Fourth Grade Graphs - Making Line Plots - This is perfect for distance learning on Zoom or similar formats. On top of that it is powerful when used as direct instruction in the classroom. It teaches the students how to collect data and then make a line plot with that data. Students also review using a ruler to measure to the eighth of an inch and use this knowledge in making their line plot. There are 22 effective teaching strategies used in this lesson base on research. For best results,
Subjects:
Grades:
4th, Adult Education
CCSS:
1.MD.4 1st Grade Math - Interpret Data Bundle with Google
1.MD.4 1st Grade Math - Interpret Data Bundle with Google Practice provides two ways for students to practice and show mastery of their ability to represent and interpret data.This bundle provides both my original PowerPoint and the new Google Slide Set products for a low upgrade fee! It includes 40 distinct problems in two sets (129 slides in all!), with and without following answer slides. These Google and PowerPoint Slide Sets can be used on computers, or Promethean and Smart boards or shared
Subjects:
Grades:
1st, Adult Education
CCSS:
3.MD.3 3rd Grade Math - Draw Scaled Picture & Bar Graph Bundle w/ Google
3.MD.3 3rd Grade Math - Draw Scaled Picture & Bar Graph Bundle w/ Google Practice provides two ways for students to practice and show mastery of their measurement skills.This bundle provides both my original PowerPoint and the new Google Slide Set products for a low upgrade fee! It includes 40 distinct problems in two sets (129 slides in all!), with and without following answer slides. The PowerPoint and Google Slide Set can be used on computers, or Promethean and Smart boards or shared with
Subjects:
Grades:
3rd, Adult Education
CCSS:
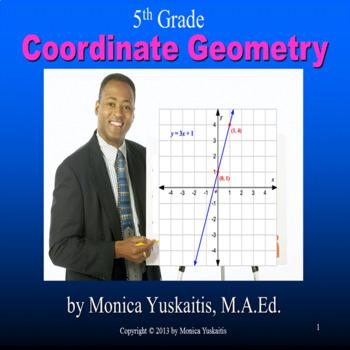
5th Grade Coordinate Geometry and Ordered Pairs Powerpoint Lesson
Fifth Grade Coordinate Geometry and Ordered Pairs - This is perfect for distance learning on Zoom or similar formats. On top of that it is powerful when used as direct instruction in the classroom. It teaches students how to identify ordered pairs and how to plot ordered pairs. Students learn the following terms: grid, coordinate grid, x axis, y axis, coordinates, and ordered pair. There are 22 effective teaching strategies in this lesson. For best results, students should have white boards
Grades:
5th, Adult Education
CCSS:
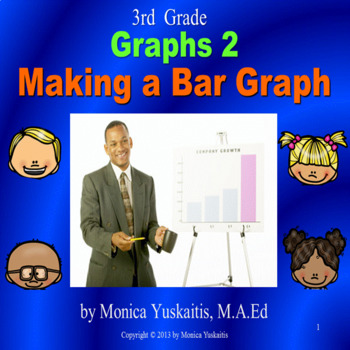
3rd Grade Graphs 2 - Making Bar Graphs Powerpoint Lesson
Third Grade Graphs 2 Making Bar Graphs - This is perfect for distance learning on Zoom or similar formats. On top of that it is powerful when used as direct instruction in the classroom. It teaches students how to make bar graphs. The following concepts are reviewed: grid, graph, coordinates, axes, scale, interval, title, and key. There are 22 strategies of effective teaching based on research in this powerpoint lesson. For best results, students should have white boards and dry erase mar
Subjects:
Grades:
3rd - 4th, Adult Education
CCSS:
Also included in: 3rd Grade Graphs Bundle - 6 Powerpoint Lessons - 277 Slides
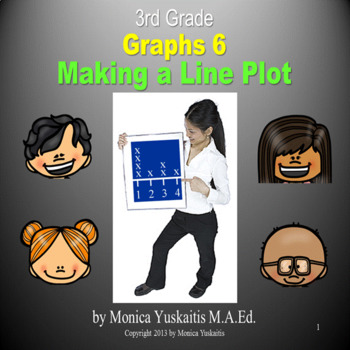
3rd & 4th Grade Graphs 6 - Making Line Plots Powerpoint Lesson
Third and Fourth Grade Graphs 6 - This is perfect for distance learning on Zoom or similar formats. On top of that it is powerful when used as direct instruction in the classroom. It teaches students how to make a line plot. Since students will be measuring to the 1/4 inch in this lesson there is also a review of how to read a ruler and how to measure with a ruler. There are 22 strategies of effective teaching based on research in this powerpoint lesson. For best results, students should h
Subjects:
Grades:
3rd - 4th, Adult Education
CCSS:
Also included in: 3rd Grade Graphs Bundle - 6 Powerpoint Lessons - 277 Slides

SmartBoard Lesson on Graphing Linear Inequalities
This is an Algebra lesson for the SmartBoard on graphing linear inequalities and systems of linear inequalities. This Notebook file starts with reviewing the inequality symbols and how to graph an inequality on the number line. It then moves on to the definition of a linear inequality and how to graph one on the coordinate plane. The steps to follow are clearly identified and several example problems are provided. The second half of this lesson gives problems about solving systems of linear ineq
Subjects:
Grades:
8th - 12th, Higher Education, Adult Education
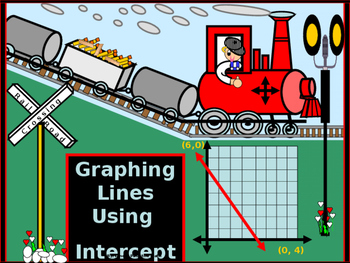
Algebra PP: Graphing Lines using the Intercepts/DISTANCE LEARNING/ NO PREP
At this point in any students' experience of learning to graph linear equations, they are beginning to notice that there are multiple variations available to them in order to graph a linear equation.
* They learn to graph a linear equation by finding the x and y intercepts.
* They learn to 'scale' their graph to fit comfortably, as needed, on the x and y axis.
* They are also provided with an example in a real life situation; they use the intercepts to graph an equation and
Grades:
6th - 10th, Higher Education, Adult Education
CCSS:
Also included in: BUNDLE: Algebra Power-point Graphing Linear Equations and Functions
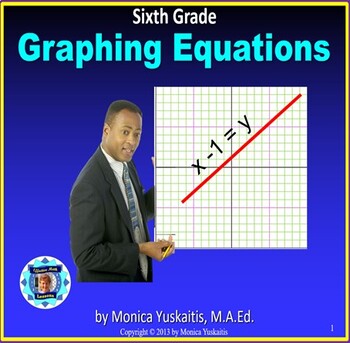
6th Grade Graphing Equations Powerpoint Lesson
Sixth Grade Graphing Equations Powerpoint Lesson is powerful when used as direct instruction in the classroom, on-line, or individually. It teaches students how to move back and forth between the t-chart table, the equation, and plotting on the graph. There is a quick review of coordinate plane geometry. There are 22 effective teaching strategies based on research used in this lesson. For best results, students should have white boards and dry erase markers. For instructions on how to suc
Subjects:
Grades:
6th, Adult Education
CCSS:
Also included in: 6th Grade Powerpoint Mega Math Bundle - 58 Lessons - 2923 Slides
Showing 1-24 of 57 results


