47 results
12th grade statistics interactive whiteboards
Introduction to Probability and Statistics Lesson Plan Bundle
Elementary Statistics - Introduction to Probability and Statistics Lesson Plan BundleThis bundle includes:-Introduction to Statistics and Types of Data-Data Collection, Sampling Techniques, and Studies-Introduction to Technology in Statistics Activity-Organizing Data Using Frequency Distributions-Histograms and Dot Plots-Graphs and Charts in Statistics-Organizing and Presenting Data Using Technology Activity-Measures of Central Tendency-Measures of Position-Measures of Variation-Introduction to
Subjects:
Grades:
10th - 12th, Higher Education
Confidence Intervals and Hypothesis Testing Lesson Plan Bundle
Elementary Statistics - Confidence Intervals and Hypothesis Testing Lesson Plan BundleThis bundle includes:-Confidence Intervals for the Mean-Confidence Intervals for Proportions-Confidence Intervals for Variance and Standard Deviation-Introduction to Hypothesis Testing-Hypothesis Testing for the Mean-Hypothesis Testing for Proportions-Hypothesis Testing forVariance and Standard Deviations-Other Uses of Hypothesis Testing-Confidence Intervals and Hypothesis Testing Test-Confidence Intervals and
Subjects:
Grades:
10th - 12th, Higher Education
Probability and Counting Rules Lesson Plan Bundle
Elementary Statistics - Probability and Counting Rules Lesson Plan BundleThis bundle includes:-Introduction to Probability-Addition Rules for Probability-Multiplication Rules and Conditional Probability-Notation and Symbols in Probability-Permutations and Combinations-Application of Counting Rules-Probability and Counting Rules Test-Probability and Counting Rules Quiz (Bonus File)-Sample Space Handout (Bonus File)-Pacing Guide (Bonus File)Preview: Please refer to the above links for additional p
Subjects:
Grades:
10th - 12th, Higher Education
Distributions of Data Lesson Plan Bundle
Elementary Statistics - Distributions of Data Lesson Plan BundleThis bundle includes:-Introduction to Probability Distributions-Mean and Standard Deviation of Probability Distributions-Binomial Distributions-The Normal Distribution-Find Z-Scores for Normal Distributions-Applications of Normal Distribution-Central Limit Theorem-Distributions of Data Test-Normal Distribution Table-Distributions of Data Quiz (Bonus File)-Pacing Guide (Bonus File)Preview: Please refer to the above links for addition
Subjects:
Grades:
10th - 12th, Higher Education
Correlation and Regression Lesson Plan Bundle
Elementary Statistics - Correlation and Regression Lesson Plan BundleThis bundle includes:-Scatter Plots and Correlation-Linear Regression-Complete Regression Analysis-Correlation and Causation-Correlation and Regression Test-Correlation and Regression Quiz (Bonus File)-Pacing Guide (Bonus File)Preview: Please refer to the above links for additional previews.Related ContentClick here to view more Elementary Statistics materialsClick here to view more Lesson Plan Bundles----Customer Tips----Get c
Subjects:
Grades:
10th - 12th, Higher Education
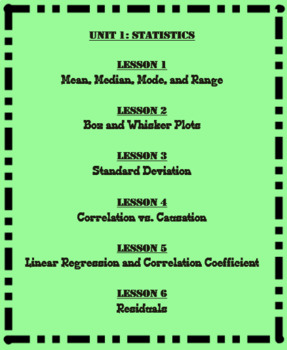
Unit 1-Statistics (Math 1)
This is the first Unit of the eight Units that I cover in Math 1. This unit is broken up in to six different lessons that are listed below. Each lesson includes a SMART Notebook presentation, a student note-taking guide, and an answer key. Also included in this unit are student flashcards, a test outline, and a 25 question multiple choice test.
Unit 1: Statistics
Lesson 1: Mean Median Mode Range Outliers and Skew
Lesson 2: Box and Whisker Plots
Lesson 3: Standard Deviation
Lesson 4: Correlati
Subjects:
Grades:
6th - 12th
CCSS:
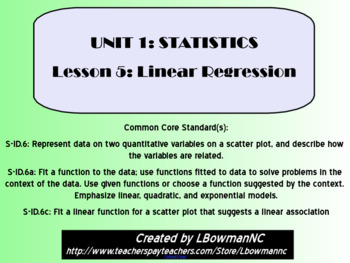
Linear Regression and the Correlation Coefficient (Math 1)
This lesson is the fifth of six lessons in the Math 1 Statistics Unit.
This lesson includes important vocabulary, examples (guided practice), and class work (independent practice). At the end of the presentation is a Ticket Out the Door that can be used as a formative assessment.
There is a note-taking guide for the students to fill out as the teacher goes through a SMART Notebook presentation.
Unit 1: Statistics
Lesson 1: Mean Median Mode Range Outliers and Skew
Lesson 2: Box and Whisker
Subjects:
Grades:
6th - 12th
CCSS:
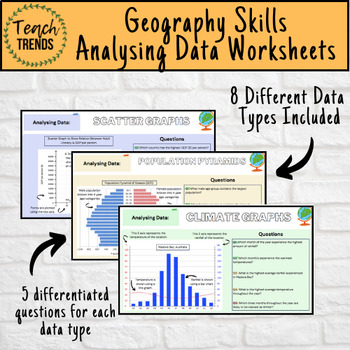
Geography Data Analysis Skills Work Booklet / Activities
Enhance your pupils’ geographical skills with a series of interpretation and analysis sheets and questions. This resource includes 8 PDF slides with corresponding questions all focused on a different data presentation method. Ideal for preparing your pupils for exams and revising analysis skills. The high quality slides include annotations, examples and five scaled-ability questions.The data presentation skills included in this resource are:Climate GraphsPopulation PyramidsChoropleth MapsScatter
Subjects:
Grades:
8th - 12th, Adult Education
Conditional Probability
This PowerPoint lesson was created for a Pre-Calculus class to review all the concepts of conditional probablility that were previously learned in Algebra 2. It includes examples and explanations of compound probability (including unions and intersections), independent & dependent events, and mutually exclusive events. It could be used as a review in Algebra 2 once all these concepts have been covered.
NOTE: Math Type 5.0 was used to create this lesson.
Subjects:
Grades:
10th - 12th, Higher Education
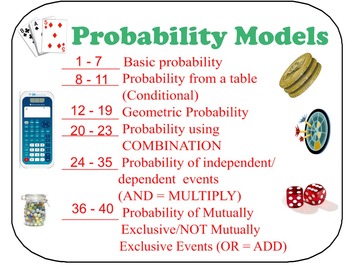
BUNDLE *** FCP, Perm, Comb, & Probability Models Lessons & Exit Ticket
BUNDLE of:
Exit Ticket on FCP, Permutation, & Combination
FCP, Permutation, and Combination - PDF 36 problems
FCP, Permutation, and Combination - Smart Notebook 36 problems
Probability Models - Power Point illustrated models
Probability Models - PDF 40 questions
Probability Models - Smart Notebook 40 questions
Visual Representation of Standard Deck of Cards
For more details, please check the individual description of those items.
Separately, these would cost more than $12.99
☺Would love
Subjects:
Grades:
6th - 12th, Higher Education, Adult Education
Probability Models
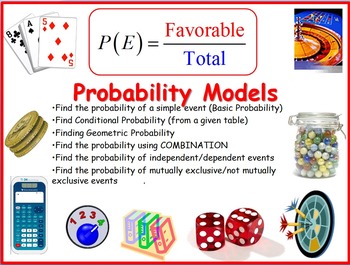
This handout drills the understanding of the different models of probability. Student would have to first determine under which model should this problem fit, then, apply the appropriate strategy to answer the questions. There are many ways to answer each of the questions provided in this handout. I provided "An" answer key.
In this handout, you will find a set of 40 questions on the following probability models:
1. Detailed visual description of the Standard Deck of Cards
2. Basic Probab
Subjects:
Grades:
6th - 12th, Higher Education, Adult Education, Staff
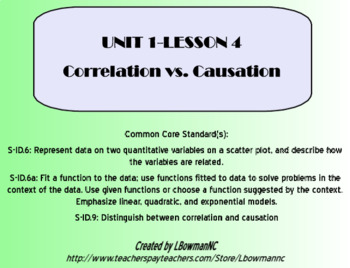
Correlation vs Causation (Math 1)
This lesson is the fourth of six lessons in the Math 1 Statistics Unit.
This lesson includes important vocabulary, examples (guided practice), and class work (independent practice). At the end of the presentation is a Ticket Out the Door for the students.
There is a note-taking guide for the students to fill out as the teacher goes through a SMART Notebook presentation.
Unit 1: Statistics
Lesson 1: Mean Median Mode Range Outliers and Skew
Lesson 2: Box and Whisker Plots
Lesson 3: Standard
Subjects:
Grades:
6th - 12th
CCSS:
Mathematical Expectation (Expected Value)
This is a Pre-Calculus lesson on Mathematical Expectation: what to expect as the average outcome if an experiment were to be repeated many times. (also called "Expected Value") It gives an explanation, then gives 7 example problems.
Subjects:
Grades:
10th - 12th, Higher Education
Mean Median Mode Range Outliers and Skew (Math 1)
This lesson is the first of six lessons in the Math 1 Statistics Unit.
This lesson includes important vocabulary, examples (guided practice), and class work (independent practice). The examples and class work are broken up in to two separate "chunks". This allows the students to establish a foundation for the topics covered before moving on to more challenging problems. At the end of the presentation is a Ticket Out the Door that can be used as a formative assessment.
There is a note-taking g
Subjects:
Grades:
6th - 12th
CCSS:
Standard Deviation (Math 1)
This lesson is the third of six lessons in the Math 1 Statistics Unit.
This lesson includes important vocabulary, examples (guided practice), and class work (independent practice). The examples and class work are broken up in to two separate "chunks". The first chunk requires the students to calculate the standard deviation by hand. The second chunk requires the students to find the standard deviation using a graphing calculator and then to use standard deviation to compare different sets of d
Subjects:
Grades:
6th - 12th
CCSS:
Residuals (Math 1)
This lesson is the last of six lessons in the Math 1 Statistics Unit.
This lesson includes important vocabulary, examples (guided practice), and class work (independent practice) on how to find the residual values for a linear regression model. At the end of the presentation is a Ticket Out the Door for the students.
There is a note-taking guide for the students to fill out as the teacher goes through a SMART Notebook presentation.
Unit 1: Statistics
Lesson 1: Mean Median Mode Range Outli
Subjects:
Grades:
6th - 12th
CCSS:
Margin of Error Lesson | SMART Board File
The file attached is an interactive SMART Board file that focuses on the topic of Margin of Error. Use this resource to help you navigate through the Common Core Algebra 2 Statistics unit. This lesson adheres to the Common Core State Standards.Structure of lesson: Aim (Objective), Do Now (Warm up), Development (Definitions/ Diagrams), Practice Questions (including Regents Questions), Summary Questions (which can be used as an Exit Ticket).Material Covered: All three formulas and when to use them
Subjects:
Grades:
9th - 12th
Types:
Box and Whisker Plots (Math 1)
This lesson is the second of six lessons in the Math 1 Statistics Unit.
This lesson includes important vocabulary, examples (guided practice), and class work (independent practice). The examples and class work are broken up in to two separate "chunks". This allows the students to establish a foundation the basics of the topics covered before moving on to more challenging problems. At the end of the presentation is a Ticket Out the Door for the students.
There is a note-taking guide for the s
Subjects:
Grades:
6th - 12th
CCSS:
Combinations & Permutations
This PowerPoint lesson was written for a Pre-Calculus class to review combinations and permutations that were learned in Algebra 2. It was also as a review of the two concepts for my Algebra 2 classes after they had worked individual lessons on combinations and permutations.
NOTE: Math Type 5.0 was used to create the lesson.
Subjects:
Grades:
10th - 12th, Higher Education
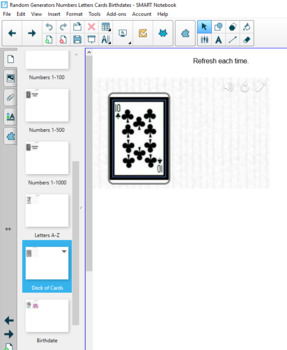
Random Number Letter Deck of Cards Birthday Generator SMART 18 Flash Replacement
If your district has upgraded to Windows 10 and SMART 18, then many of your highly-used flash components will no longer work. I have been recreating them in the new SMART 18. These Random Generators (Numbers 1-36, Numbers 1-100, Numbers 1-500, Numbers 1-1000, Letters A-Z, Playing Card from a Deck of Cards, & Birthdate) are comparable to what was previously available in SMART, though they operate differently.Random Generators SMART 18 Flash Replacement by Brian Tillmann is licensed under a Cr
Subjects:
Grades:
K - 12th, Staff
Types:
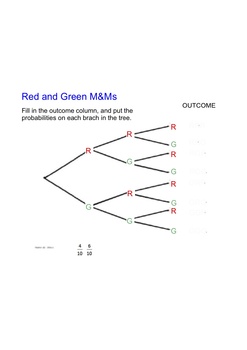
Christmas MMs probability task: Smart Notebook
I use this lesson with my Yr 8 class at Christmas time and they love it! It begins with a game with each student having a cup and 10 m&ms. It is rich in mathematical concepts, but you can bypass these and just focus on the repeated trials and using tree diagrams. The task can be used in higher levels to teach binomial probability and distribution, replacement vs non-replacement, multiplication rule etc. I use packets of red and green m&ms which are available at this time of the year, bu
Subjects:
Grades:
7th - 12th
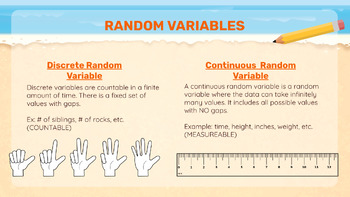
Normal Distributions and Random Variables: Guided Lesson: High School Statistics
This is a guided lesson on normal distributions and random variables. The lesson walks students through examples on how to identify discrete and continuous variables. It also goes over normal distributions, the empirical rule, and how to find z-scores. This lesson includes examples that you can use to walk students through the problems. If you teach with a tablet, iPad, or a Smart board, this lesson is adaptable to these technologies. Students love the interactive lesson! If you teach with Stats
Subjects:
Grades:
10th - 12th
CCSS:
Also included in: Normal Distributions and Random Variables Bundle: High School Statistics
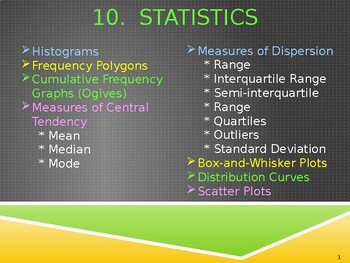
Grade 11 Maths: Statistics in PowerPoint
Histograms, frequency polygons, cumulative frequencies, graphs, measures of central tendency - mean, median & mode, measures of dispersion, box-and-whisker plots, distribution curves, scatter plots, explanations, examples and exercises. Excellent for classroom teaching with a data projector & use on mobiles.
Subjects:
Grades:
10th - 12th, Not Grade Specific
Also included in: G 11 Maths: Statistics, finance growth and decay in animated PowerPoint.
Grade 12 Statistics in PowerPoint
Measures of central tendency & spread, five-number summary, distribution data & curve, skewed to the right distribution & curve, scatter plots with positive negative and no correlation, least squares regression line, predictions using the line of best fit, correlations, interpreting correlation coefficient, positive strong correlation, negative & weak correlation, no correlation. Excellent for classroom teaching with a data projector and also can be used on a mobile phone.
Subjects:
Grades:
11th - 12th, Not Grade Specific
Also included in: G 12 Maths: Statistics, counting and probability in animated PowerPoint.
Showing 1-24 of 47 results


