41 results
3rd grade statistics interactive whiteboards
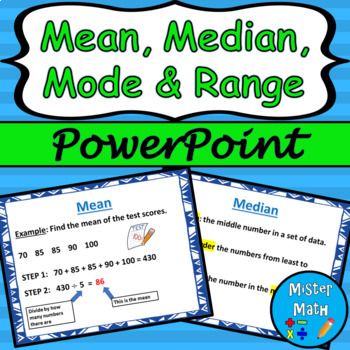
Mean, Median, Mode & Range PowerPoint Lesson
This is a PowerPoint Lesson to assist students in learning about finding the mean, median, mode, and range of data sets. The PowerPoint includes key vocabulary, as well as an example for each skill. Plenty of real-life examples are included to give students ample opportunities to connect the skills to the real world. The presentation also comes fully animated, with animations triggered by mouse click (or presentation pointer!)This PowerPoint lesson is also part of a BUNDLE that includes a guided
Subjects:
Grades:
3rd - 6th
Also included in: Mean, Median, Mode & Range PPT and Guided Notes BUNDLE
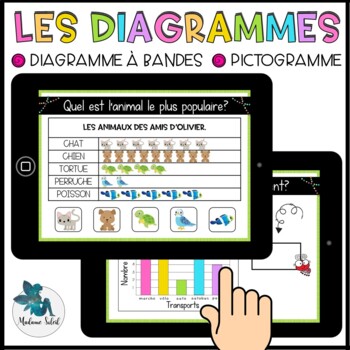
Les diagrammes au 1er cycle Boom Cards French distance learning
French pictograph, french graph. Activité mathématique de statistique permettant de travailler le diagramme, les diagrammes, le pictogramme, les graphiques, l'histogramme ou le diagramme à bande pour des élèves de 1re année, 2e année et 3e année. Super en groupe, en atelier, dans les centres mathématiques, à distance et à la maison. French immersion.Viens l'essayer avant de l'acheter !C'est quoi?20 Cartes Boom dans lesquelles les élèves doivent :- Analyser les diagrammes.- Répondre à la question
Subjects:
Grades:
1st - 3rd
Also included in: Bundle 1re année mai mathématique BOOM CARDS French distance learning
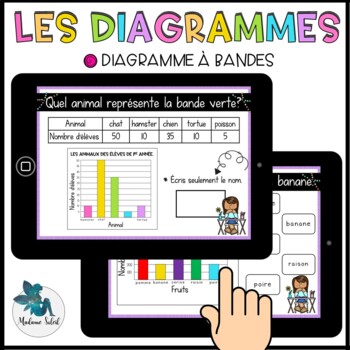
Les diagrammes à bandes en 2e année Boom Cards
French graph. Activité mathématique de statistique et d'enquête permettant de travailler le diagramme, l'histogramme ou le diagramme à bande pour des élèves de 2e année et 3e année. Super en atelier de math, dans les centres mathématiques, à distance et à la maison. Viens l'essayer avant de l'acheter !C'est quoi?20 Cartes Boom dans lesquelles les élèves doivent :- Analyser les diagrammes.- Répondre à la question.DescriptionC'est une activité auto-correctrice avec laquelle l'enfant reçoit une rét
Subjects:
Grades:
2nd - 3rd
Also included in: Bundle 2e année mars mathématique Boom Cards
Open-Ended Math Questions - Chance and Data
This product targets chance, data, graphing and probability by asking the students open ended questions about the topic. This provides an entry point for all students and allows the teacher to quickly gauge the varying levels of knowledge and understanding in the classroom. The PDF is intended to be displayed on an interactive whiteboard and students could answer the questions orally, on mini whiteboards or on the included student response sheet. The student response sheet could also be used as
Subjects:
Grades:
3rd - 5th
Also included in: Open Ended Math Questions BUNDLE - Over 65 Different Questions!
Data Slides Bundle
This is a bundle of two slideshows to introduce data concepts to your students (TEKS 4.9/CCSS 4.MD.B). Two skills are included:-Data representations (4.9A and B/4.MD.B.4)-Solving multi-step problems using data (4.9B/4.MD.B.4)This is a great deal for all of TEKS in unit 7/CCSS units on data. PowerPoints and PDFs are also available individually if you'd prefer to purchase each standard separately. This bundle helps you save as it includes both the editable PPT and non-editable PDF versions of all
Subjects:
Grades:
3rd - 5th
CCSS:
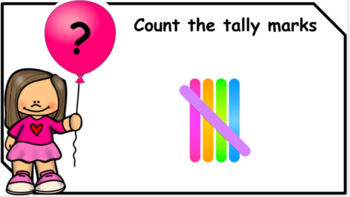
*No Prep* Counting Tally Marks *Google Slides/Distance Learning
This is designed for Google Slides *Widescreen 16:9.I want to help all those teachers struggling to find new ideas for their Google Slides. I will be adding more maths resources to my store.The student types the answer into the text box.There are 40 slides.Tally marks from 1-20 are used. There are 2 copies, a girl and boy option.
Subjects:
Grades:
K - 3rd
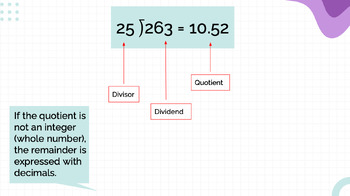
Order of Operations, Multiplying Decimals, Remainders, Graphs, Google Slides
Google Slides for different math topics: - Order of Operations (examples, breakdown of order) - Multiplying Decimals (Step by step guide and examples to practice)- Dividing Natural Numbers with a Decimal Remainder- Statistics (how to make a survey question, organize into data table, features of a graph, average problem)
Subjects:
Grades:
2nd - 8th
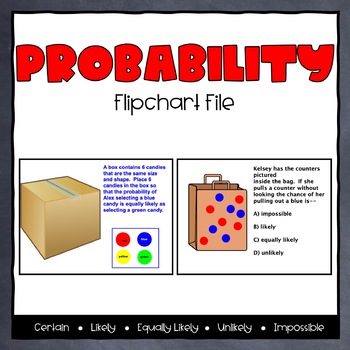
Probability ActivInspire Flipchart
This flipchart has 33 slides that have various types of practice with understanding probability. This flipchart introduces the concept of probability as chance and defines the 5 main descriptor words associated with probability (certain, likely, equally likely, unlikely, and impossible). It reinforces the concepts with examples. It also reviews the probability words and has several multi-step, technology-enhanced examples for student practice.The flipchart is designed for whole-group but coul
Subjects:
Grades:
2nd - 4th
Types:
Data Analysis and Comparison Review PPT (Graphs)
This is a 24-slide PowerPoint on data analysis and comparison that I use in my 3rd grade classroom as a review before our test. This PowerPoint would also be useful for upper grades to review and activate background knowledge before delving further into data analysis.
It includes 10 vocabulary questions (data, survey, results, frequency table, tally table, pictograph, bar graph, line plot, scale, key). It also includes three slides that contain a bar graph, pictograph and line plot, and contain
Subjects:
Grades:
3rd - 5th
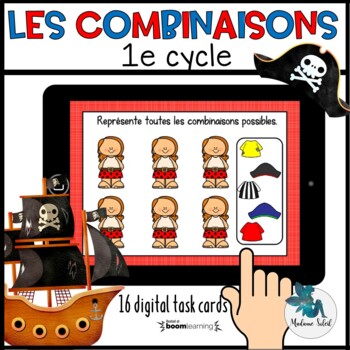
Les combinaisons chez les pirates Boom Cards French distance learning
Activité mathématique permettant de travailler sur le hasard (possibilités) et les combinaisons possibles sous le thème des pirates. Cette activité ne permet pas d'être autocorrigé. Une supervision adulte est nécessaire pour vérifier la compréhension de l'élève.Super en grand groupe, en petit groupe, pour le tableau blanc, dans les centres mathématiques, en orthopédagogie, à distance et à la maison.Viens l'essayer avant de l'acheter !C'est quoi?16 Cartes Boom dans lesquelles les élèves doivent
Subjects:
Grades:
1st - 3rd
Also included in: Bundle 1re année mars mathématique BOOM CARDS French distance learning
*FREE Sample* No Prep Tally Marks *Google Slides/Distance learning*
This is a free sample of my No Prep Digital Resource of Counting Tally Marks.This is designed for Google Slides *Widescreen 16:9.I want to help all those teachers struggling to find new ideas for their Google Slides. The student types the answer into the text box.I have the full version with 40 slides for sale in my store.
Subjects:
Grades:
K - 3rd
Data Analysis & Probability - PC Gr. 3-5
**THIS is a PC Version**This PC Flash version (compatible with any brand of IWB) is to be used on a PC platform and can be used on a computer, IWB or PC tablet.**PLEASE NOTE: This resource requires FLASH to be installed on your device.Click Here To View Product DemoFor students in grades 3-5, our ready-made Math program has over 230 individual activities on over 80 engaging and highly interactive screen pages. About this Resource: Your students will have ample opportunity to learn all the expect
Subjects:
Grades:
3rd - 5th
Data Analysis & Probability - MAC Gr. 3-5
**THIS is a MAC Version that will ONLY work on MAC OS 10.9.5 Mavericks or earlier.**This MAC Flash version (compatible with any brand of IWB) is to be used on a MAC platform and can be used on a computer or IWB.**PLEASE NOTE: This resource requires FLASH to be installed on your device.Click Here To View Product DemoFor students in grades 3-5, our ready-made Math program has over 230 individual activities on over 80 engaging and highly interactive screen pages. About this Resource: Your students
Subjects:
Grades:
3rd - 5th
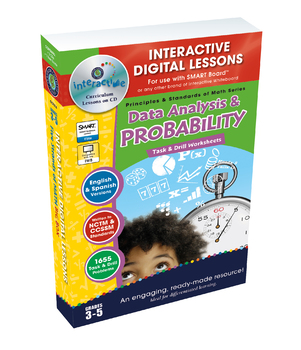
Data Analysis & Probability - NOTEBOOK Gr. 3-5
**THIS is a SMART Notebook Version**You will need SMART Notebook software to open this resource.**PLEASE NOTE: This resource requires FLASH to be installed on your device.Click Here To View Product DemoFor students in grades 3-5, our ready-made Math program has over 230 individual activities on over 80 engaging and highly interactive screen pages. About this Resource: Your students will have ample opportunity to learn all the expectations within the NCTM and your State Curriculum Math Strand of
Subjects:
Grades:
3rd - 5th
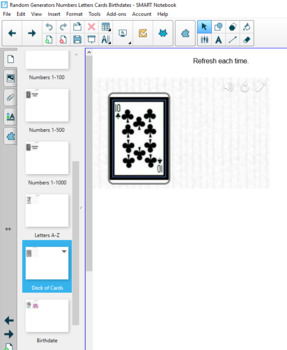
Random Number Letter Deck of Cards Birthday Generator SMART 18 Flash Replacement
If your district has upgraded to Windows 10 and SMART 18, then many of your highly-used flash components will no longer work. I have been recreating them in the new SMART 18. These Random Generators (Numbers 1-36, Numbers 1-100, Numbers 1-500, Numbers 1-1000, Letters A-Z, Playing Card from a Deck of Cards, & Birthdate) are comparable to what was previously available in SMART, though they operate differently.Random Generators SMART 18 Flash Replacement by Brian Tillmann is licensed under a Cr
Subjects:
Grades:
K - 12th, Staff
Types:
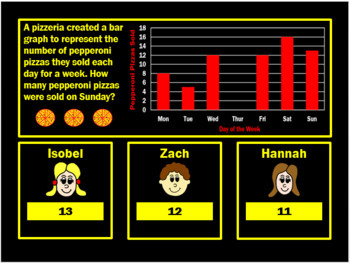
Bar Graphs Powerpoint Game by Arithmetickx
A fun, interactive PPT game to develop children’s knowledge and understanding of bar graphs. This game is suitable for Grade 2 and beyond. All Arithmetickx games incorporate 10 questions which increase in difficulty as the games progress. The games include problem solving and reasoning questions. They are ideal for a 'hook' activity, teaching tool, or assessment tool. All games include a Student Response Sheet.
Subjects:
Grades:
2nd - 5th
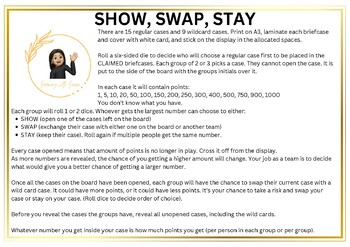
Show, Swap, Stay - Probability Activity Years 3-7
Fun probability activity where students claim a suitcase with a specific number of points, and need to decide if they want to keep or swap that suitcase throughout the game. Inspired by "Deal or No Deal", students engage with applied probability learning, and can earn house points (or an equivalent points-based reward system) at the same time!A game where everyone wins, but some people just win a little bit more than others. Requires a display, and some cutting and laminating of the cases. But o
Subjects:
Grades:
3rd - 6th
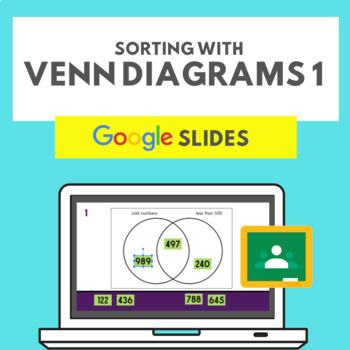
SORTING WITH VENN DIAGRAMS 1 - GOOGLE SLIDES
Students are presented with three types of Venn Diagrams and a set of data. Slides are interactive, allowing students to move the numbers into the correct position on the diagrams.
Subjects:
Grades:
3rd - 5th
Represent and Interpret Data Using Line Plots - 4.MD.4
Read and draw line plots, and use the data to answer basic questions. Scaffolded lesson provides for classroom differentiation. Can be used as a lesson leader, guided practice, independent practice, for cooperative learning and math centers, or as an assessment. Use with smartboard, projector, computer, pad or as printable. Lesson is complete - NO PREP.
Objectives:
- Interpret line plots
- Given data sets create line plots
- Answer questions using data in line plots
Includes 6 practice pages and
Subjects:
Grades:
3rd - 6th
CCSS:

Reviewing Data (Median, Mode, and Range)
This Smart Board lesson was designed for third graders as a review of Measures of Central Tendencies. The lesson includes a review of maximum and minimum value, range, median, and mode. Students review the material together as part of the Smart Board lesson and then work in a cooperative group to practice. The lesson includes directions for the cooperative activity and the necessary cards.
Subjects:
Grades:
2nd - 4th

Math SMARTboard Lesson: Probability Predict an Outcome
This smart board lesson was created to guide my instruction with my 3rd graders on how to predict an outcome using probability. Included in this lesson is an essential question, lots of interactive student practice, and a total of 8 slides.
Subjects:
Grades:
2nd - 5th
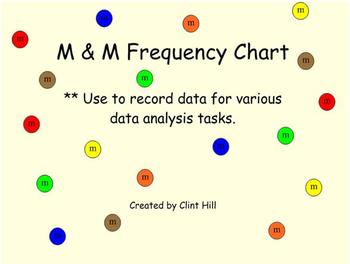
M&M's Frequency Chart
This is an M&M's frequency chart created by Clint Hill to be used in gathering data from M & M activities. This file is a notebook file for use on a SMARTboard. The file can be used alongside actual M & M's or independently of candy. Once M & M data is gathered, it is your choice as to what can be done with it. You could create various graphs representing the data or discuss mean, median, mode, and range (central tendency).
Subjects:
Grades:
K - 4th
Types:
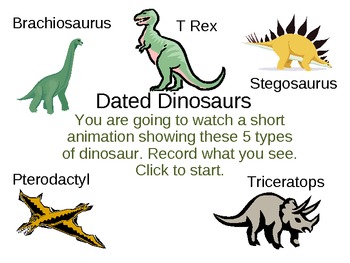
Dinosaur Data POWERPOINT
This is a fun animation, with sound, lasting 2 minutes, showing 25 dinosaurs walking and flying through a forest setting. Pterodactyls, T Rex and others are shown. Children love this and like to repeat the activity. Pupils have to decide how to collect and display the data. This is a simple statistics activity, using tally charts, frequency tables and mode. There is also a data collection sheet.
Subjects:
Grades:
1st - 3rd
SMARTBOARD lesson on ratios, fractions, percentages, and more
This smartboard lesson showcases how ratios, fractions, decimals, probabilities, and percentages are all similar ways of looking at the same thing. Each page has a spinner with a different amount of colored slices on it. As you go from many slices to fewer slices, the chance of correctly predicting what color comes up gets much better.
Have students 'bet' classroom rewards like tickets or candy to see who can correctly guess the most colors as you go through the lesson.
Subjects:
Grades:
3rd - 12th, Adult Education
Showing 1-24 of 41 results


