TPT
Total:
$0.00

Health Insurance in America Part 1 (Activity and Teacher Guide)

Rated 5 out of 5, based on 1 reviews
5.0 (1 rating)
;
Grade Levels
9th - 12th, Homeschool
Resource Type
Standards
Formats Included
  • Google Docs™
Pages
12 pages
$5.00
$5.00
Share this resource
Report this resource to TPT
Made for Google Drive™
This resource can be used by students on Google Drive or Google Classroom. To access this resource, you’ll need to allow TPT to add it to your Google Drive. See our FAQ and Privacy Policy for more information.
Also included in
  1. Health Insurance in America: Rolling Dice, Expected Value, and RiskThis five part, mix-and-matchable, large group simulation activity illustrates the fundamental probability dynamics involved in the area of health insurance. In every part, students start with some money and a die (these can be physi
    Price $20.00Original Price $25.00Save $5.00

Description

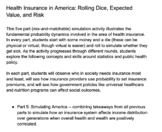
Part 1 -- Health Insurance in America: Rolling Dice, Expected Value, and Risk

This five part (mix-and-matchable) simulation activity illustrates the fundamental probability dynamics involved in the area of health insurance. In every part, students start with some money and a die (these can be physical or virtual, though virtual is easier) and roll to simulate whether they get sick. As the activity progresses through different rounds, students explore the following concepts and skills around statistics and public health policy.

In each part, students will observe who in society needs insurance most and least, will see how insurance providers use probability to set insurance premiums, and will see how government policies like universal healthcare and nutrition programs can affect social outcomes.

  • Part 1: Why insurance exists, simulation, basic probability rules, intuition of expected cost. 
Total Pages
12 pages
Answer Key
Included
Teaching Duration
40 minutes
Report this resource to TPT
Reported resources will be reviewed by our team. Report this resource to let us know if this resource violates TPT’s content guidelines.

Standards

to see state-specific standards (only available in the US).
Define a random variable for a quantity of interest by assigning a numerical value to each event in a sample space; graph the corresponding probability distribution using the same graphical displays as for data distributions.
Calculate the expected value of a random variable; interpret it as the mean of the probability distribution.
Develop a probability distribution for a random variable defined for a sample space in which theoretical probabilities can be calculated; find the expected value. For example, find the theoretical probability distribution for the number of correct answers obtained by guessing on all five questions of a multiple-choice test where each question has four choices, and find the expected grade under various grading schemes.
Develop a probability distribution for a random variable defined for a sample space in which probabilities are assigned empirically; find the expected value. For example, find a current data distribution on the number of TV sets per household in the United States, and calculate the expected number of sets per household. How many TV sets would you expect to find in 100 randomly selected households?
Weigh the possible outcomes of a decision by assigning probabilities to payoff values and finding expected values.

Reviews

Questions & Answers