Comparing Linear, Quadratic, Exponential Regressions w/Spreadsheets
Holland Math
48 Followers
Grade Levels
9th - 12th
Subjects
Resource Type
Formats Included
- Zip
- Excel Spreadsheets
Pages
4 pages
Holland Math
48 Followers
Description
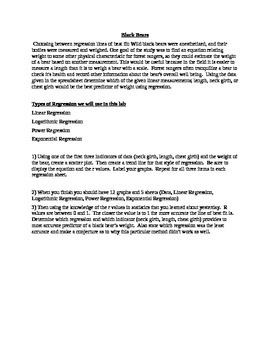
This project incorporates spreadsheets with scatter plots and lines of best fit. It asked students to perform various regressions, such as linear, power, exponential, and logarithmic, The students are asked to generate an model to help park rangers determine the weight of black bears by using only one of three measures, neck girth, length, and chest girth. Calculating the bears weights allow the rangers to anesthetize them in order for them to care for the bears. The r values in this project suggest that one model is best but if students also examine the graph they will find that the model with the highest r value does not in fact fit the points the best because it suggest that the measurement could be infinite. This is a great group project, especially if using Google Docs spreadsheets to collaboratively work on the project. After the spreadsheets and regressions, students are asked to complete a written lab report modeled after the traditional high school science template.
Total Pages
4 pages
Answer Key
N/A
Teaching Duration
2 hours
Report this resource to TPT
Reported resources will be reviewed by our team. Report this resource to let us know if this resource violates TPT’s content guidelines.


