34 results
Statistics projects for Microsoft PowerPoint
Statistics Project - Statistics Olympics
Engage your students in their study of statistics as they compete in self-created Olympic style events. This project will engage students and help them discover meaning and apply concepts including measures of central tendency, quartiles, outliers, variance, standard deviation, z-scores, box plots, histograms, normal and skewed distributions. This project can be completed in approximately 6-8 days (50-min class periods) ** March 2023 Update **Visual updates to all slides and documentsRubric ali
Subjects:
Grades:
6th - 12th
CCSS:
Mean, Median, Mode, and Range (Bundled Unit) - Distance Learning
This is an enjoyable, interactive, and engaging bundled unit covering mean, median, mode, and range (and introduces outliers). This unit is great for 5th and 6th graders and 7th graders who struggle with these concepts.Included in this bundled unit:PowerPointAnimated and fun 4-part, 21-slide PowerPoint (multi-day use)-Part 1 – The Meaning of Mean-Part 2 – Getting in the Middle of Median-Part 3 – Making the Most of Mode-Part 4 – Home, Home on the RangeEach section offers plenty of practice probl
Subjects:
Grades:
5th - 7th
Geometry: Survey and Circle Graph Project Made Fun!
Circle Graph Geometry Activity - Everyone just wants their piece of the pie!This is a fun, multi-faceted project that will have your students creating and implementing a survey, converting their results using various mathematical operations, and creating a poster-sized circle graph incorporating various geometry skills.This Survey and Circle Graph Project Unit Includes:PowerPoint:-Fun, interactive, 3-part PowerPoint slide presentation that walks you and your students through the entire project f
Subjects:
Grades:
5th - 7th
Probability project using Real-World March Madness Tournament
Jump into the March Madness tournament to apply probability concepts to a real-world application. Great for your sports-loving students. Students explore probability first by determining the probability that a team will win. Students, further, weight teams based on historical data and/or team statistics. This mini-project allows for creative problem-solving and has some open-ended answers.Included in this resource:★ Student pages for 3 March Madness related activities★ Detailed guidelines fo
Subjects:
Grades:
7th - 10th
Types:
Also included in: 7th Grade Math Resource Bundle
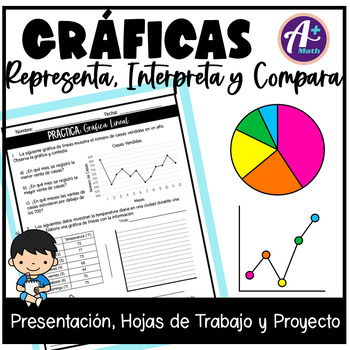
Gráficas - Estadística
Gráficas - Estadística - Analizar DatosEste recurso trabaja los siguientes temas:Gráficas: Representa, Interpreta y Compara•Recopilar y Organizar Datos •Tabla de Frecuencias•Gráfica de Barras•Gráfica Circular•Gráfica Pictórica•Gráfica Lineal•Tabla de Tallo y Hojas•Diagrama de PuntosEl recurso incluye:•Presentación en PowerPoint y PDF - 55 diapositivas con explicaciones y ejemplos•8 hojas de trabajo - Incluye la clave de respuestas•3 hojas de trabajo - Proyecto - Encuesta y analiza los res
Subjects:
Grades:
4th - 6th
Data Project Misleading Data Analysis Statistics
Statistics can be used to share information. Sometimes the data is misleading. In this AP Statistics mini project students examine how data can be used to tell a story AND how that story can be incomplete. This is part of the AP Statistics curriculum.Included in this resource:Warm-up activity for misleading dataMisleading data project guidelinesEditable RubricAnswer key for activityThis resource can be found in the following bundles:AP Statistics CurriculumAP Statistics Unit 1Get students r
Subjects:
Grades:
9th - 12th
Types:
CCSS:
Also included in: Descriptive Statistics AP Statistics
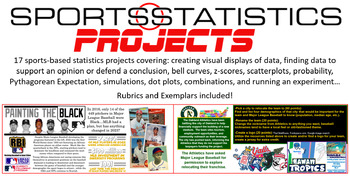
Sports Statistics - Projects ONLY! 17 projects in all
Most of the projects allow students to choose their own topic to display their understanding of statistical topics. Students will:Create a graph of their choosing given dataDesign an infographic on the subject of their choosingResearch and defend their G.O.A.T. choice in a variety of categoriesUse demographics to relocate and rebrand a professional franchiseResearch social injustices in sports and display the dataCreate a bell curve based on career statistics of Michael JordanCompare the salari
Subjects:
Grades:
8th - 12th
CCSS:
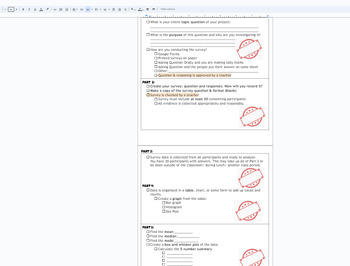
Statistics Survey project Discovery (broken down into sections) with Rubric
This is a broken down (scaffolded) packet of instructions/ guide for a Stats Project for Math 1 HS or 8th grade students. The goal of the project is for students to take a statistical survey on quantitative data (numbers) of their choice. Using this data from the survey, the following will be included in the project:Survey- the question being askedSurvey responses (requirement of 30)Data organization: Bar chart, Histogram, Dot PlotMeanMedianModeBox and Whisket Plot5 number summary (Q1,Q2,Q3, min
Subjects:
Grades:
7th - 12th, Higher Education, Adult Education
CCSS:
7th Grade Math Weather Project - Data Analysis, Measure of Center
Editable PowerPoint: so you can make it your own.I made an example of what a project could look like also.Use this for mean, median, mode, range. You can add other things as well.Good for distance learning.
Subjects:
Grades:
6th - 8th
Types:
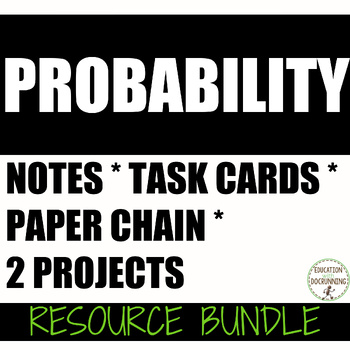
Probability Algebra 2
This bundle of resources for Algebra 2 Unit 10 Probability is available at a discount for a limited time. Included in this bundle (when it is finished):- Color-coded graphic organizers on probability topics listed below- Black-line master graphic organizers on probability topics listed below- Color coded notes with examples- Practice problems (good for homework)- Answer key for practice problems- 2 projects for assessment- Paper chain, card sort, task cards and more for additional practice- Sug
Subjects:
Grades:
10th - 12th
CCSS:
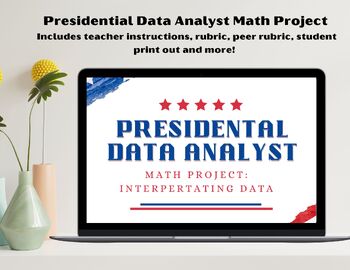
Presidential Data Analyst Math Project | Excel | Presentations | Presidents Day
Elevate your Presidents' Day lesson plans with this comprehensive Presidential Data Analysis Math Project, designed to engage students in a deep exploration of U.S. presidential history through mathematical analysis. This invaluable resource provides educators with everything they need to guide their students through a dynamic and informative project that combines historical research with mathematical concepts.**Key Features:**1. **Thematic Relevance:** - Aligned with Presidents' Day, this o
Subjects:
Grades:
7th - 10th
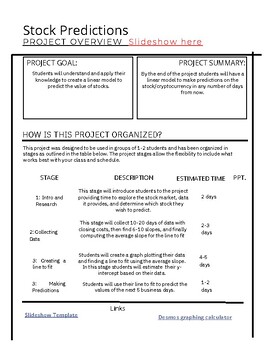
Data and Stocks Unit Project Based Learning
A 1-2 week long data unit to introduce the stock market to students through a project based learning unit. Students will be asked to create lines to fit to a stock of their choice by tracking it's data and researching current business news. Throughout the unit if need be may need to supplement with procedural practice problems, or reviewing students data plots to discuses various trends through a presentation at the end of the unit for an assessment to describe data. My students really enjoyed t
Subjects:
Grades:
8th - 10th
Normal Distributions Activity
Kick off your study of normal distributions with this inquiry activity. This activity is part of Unit 3 in the AP Statistics curriculum:Included in this resource:Student pages for 2 inquiry activities EDITABLETeacher DirectionsNOTE: The 2nd activity requires a pair of dice for each group of students. Groups should consist of 2-3 students. If you do not have dice, you can use an online dice simulator.This resource can be found in the following bundles:AP Statistics CurriculumGet students ready
Subjects:
Grades:
9th - 12th
Types:
CCSS:

Journalism: Market Research Project Slideshow
Prepare your high school journalism students for the exciting world of media with our comprehensive "Market Research Project Slideshow." This 43-slide PowerPoint presentation is thoughtfully designed to guide students through the intricacies of market research, including data analysis, question, and focus generation, all tailored to the context of a high school newspaper.Key Features:Structured Learning: Our slideshow offers a systematic and well-structured approach to teaching market research,
Subjects:
Grades:
7th - 12th
CCSS:

Qualitative and Quantitative Data Graphing Project Collecting Data Rubric
Descriptive Statistics Project Qualitative and Quantitative Data Graphical ReperesentationsTo get students more engaged with their math assessment, have them collect data for a project. Some sample question are provided for both qualitative and quantitative data sets. Or, student have the option of creating their own question.Students are asked to collect data from 50 students for both qualitative and quantitative data survey questions. This file is editable, so if 50 students seems like too
Subjects:
Grades:
9th - 12th
Types:
CCSS:
Experiment and Sampling Project AP Statistics EDITABLE rubric
Choose 2 of the 3 projects to assess students understanding of sampling, data collection, experimental design for AP Statistics. This is part of the AP Statistics curriculum. Included in this resource:Scope of project3 parts of projectEditable RubricSuggested solutions/answer keyPDF of all of the above for those who do not have powerpoint or access to google slides.This resource can be found in the following bundles:AP Statistics CurriculumAP Statistics Unit 2Get students ready for the AP St
Subjects:
Grades:
9th - 12th
Types:

Data Handling: Traffic Nightmare Tally and Bar Charts Project
A fantastic and very comprehensive resource including a Traffic Nightmare project book, lesson plan, student objective sheets, PowerPoint extended data collection exercise, PowerPoint Tally Chart Bingo, student bingo sheet and a PowerPoint introduction to using tally charts.
This project focuses on a scenario where the opening of a local supermarket has resulted in a great increase in heavy traffic through a residential area. The students tally the vehicles they see on screen to 'prove' the incr
Subjects:
Grades:
Not Grade Specific
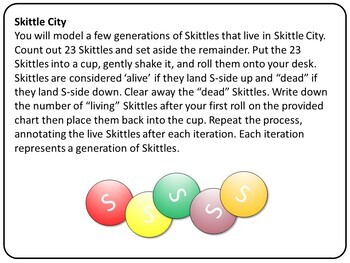
Skittle City: A Fun Mathematical Modeling game for recursion and probability
This exercise is incredibly fun! It is designed to challenge students to explore data analysis and discover about the math concepts of recursion and probability. Students break up in groups and work on modeling a notional Skittle City population. I firmly believe that experience should come before learning formal math formulas and definitions. This is a great way to get the students engaged and have them learn these concepts without even realizing it!Full instructor guide and Answer Key included
Subjects:
Grades:
3rd - 12th
Types:
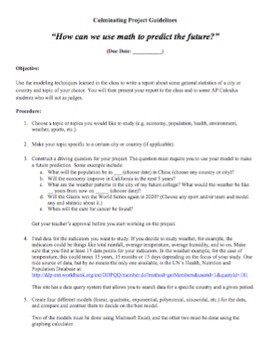
Functions Regressions Project: Using Math to Predict the Future
This project focuses on different kinds of functions and their applications in the real world. Students will “model with mathematics” using different approaches. In this project students will use modeling techniques to make future predictions using general statistics of a city or country and topic of their choice. Students look at different types of data; they analyze and interpret the data to decide which function best models the data. Students generate regressions of different types of functio
Subjects:
Grades:
9th - 12th
Also included in: Math in the Real World Projects Bundle
Statistics Investigator for Algebra 1 - Power Point
This is the power point presentation that is to help guide the students through a math modeling activity. The students are detectives that determine if a hand, foot, or femur is the best measure of height. It goes along with the handouts that are also listed on my site. The students need knowledge of linear regression, causation vs. correlation, and residuals. This usually takes about 2 days to complete.
Subjects:
Grades:
8th - 12th
CCSS:

La Statistique et la Probabilité
This lesson pack includes a powerpoint introduction to statistics and probability. I have used this lesson with students in grades 7 through 9 (as either an introduction or a review). The powerpoint lesson includes some terms, notes, interactive questions and activities, notes for the teacher where required below slides. Afterwards, there is a printable PDF project that students complete either individually or as partners using Skittles, and paper cups. The project also has students review gra
Subjects:
Grades:
7th - 9th
Scatterplots Statistics Project Group Presentation Experiment
This project requires students to determine a hypothesis, collect data, make a scatterplot, and analyze the scatterplot for an correlations. Then, students will make predictions, determine if their hypothesis was correct, and present their findings to the class. This project can be used as an independent assignment or as a group project. It can be added to Canvas as a Google Assignment. The project comes with an already made rubric.
Subjects:
Grades:
6th - 12th
CCSS:

Probability Unit
Included in this bundle are PowerPoint lessons for pre-Algebra probability. This bundle includes lessons on the following topics:Experimental and Theoretical ProbabilityMaking SurveysIndependent and Dependent EventsPermutationsCombinationsAll lessons are animated, have definitions, examples, and answers. Homework problems are not supplied because we all use different textbooks.As a bonus, I have also included a short Project Based Learning (PBL) activity on Making Surveys. You can assign and
Subjects:
Grades:
7th - 9th

Samples and Populations
This lesson will allow students to understand the concept of Samples and Populations. It has the content and videos which will provide students an engaging lesson. It also has links to an online survey that you as the teacher can conduct and control (This will need to be adapted to suit your specific class). Also included is question examples and activities for the students to engage with. The lesson goes through the following topics: samples, populations, surveys, census questionnaires and coll
Subjects:
Grades:
7th - 9th
CCSS:
Showing 1-24 of 34 results


