123 results
Free statistics projects
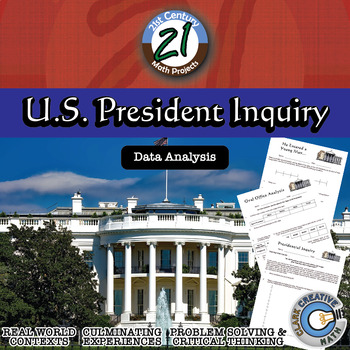
U.S. President -- Data Analysis & Statistics Inquiry - 21st Century Math Project
Engage students in data analysis through use of Presidential data in this 21st Century Math Project. Students will create box and whisker, stem and leaf, histograms and scatterplot through their investigations. In the end, students will take on the inquiry question: "Do US Presidents with the most children live longer after they have been inaugurated?" ***THIS PRODUCT HAS BEEN UPDATED WITH A GOOGLE SLIDES INTERACTIVE VERSION INCLUDED. REDOWNLOAD IF YOU HAVE IT ALREADY***-- In "He Entered a Youn
Subjects:
Grades:
6th - 12th
Types:
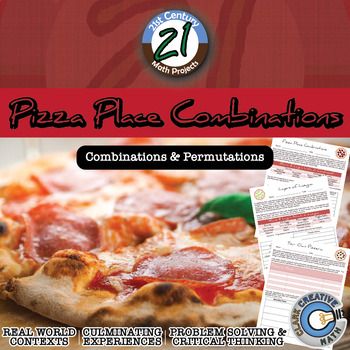
Pizza Place Combinations -- Combinations and Permutations - Math Projects
Pizza! Pizza! Mario & Luigi’s Pizzeria wants to make sure everyone knows that they are the best of the best. At their pizzeria, they allow customers to choose any number of toppings from their list to create pizzas and lasagnas. Join in on the fun with this 21st Century Math Project!In this 9 page PDF, you will be given a mapping to the Content Standards, an outline for how to implement the project, 3 different assignments for students to use, and an answer key. ***THIS PRODUCT HAS BEEN UPDA
Subjects:
Grades:
5th - 9th
Types:
CCSS:
Also included in: Probability & Expected Value Unit Bundle - Distance Learning Compatible

Statistics Cell Phone Project with Rubric
This statistics project is extremely engaging because the students are required to collect relevant data pertaining to cell phone usage. Student will then be asked to analyze(Five Number Summary) and display the data in a myriad of formats (Frequency Histograms, Box-and-Whisker, Stem and Leaf, etc)
For the Excel file, please email me at E_Sigman@yahoo.com after purchase.
Subjects:
Grades:
7th - 12th
Types:
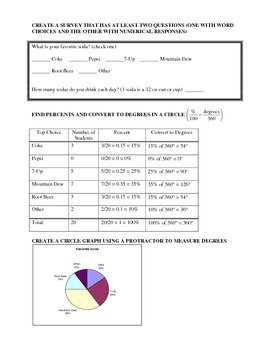
Construct a Survey Lesson/Project Plan
This PDF document consists of three parts: a lesson plan, project instructions, and a grading rubric. The lesson has students construct a survey that will have at least two questions: one that is multiple choice and one that has a numerical answer. It can either be an individual assignment or a group assignment and takes 2-3 days. I used this towards the end of the year as a review exercise since it covers multiple concepts: percents, circle graphs, central tendency (with outliers), box-and-whis
Subjects:
Grades:
6th - 9th
Types:
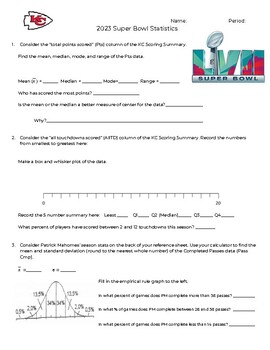
2023 Super Bowl Statistics Activity
This activity contains two stats sheets - one for the Philadelphia Eagles and one for the Kansas City Chiefs. Students are asked to use the data from the various tables to answer questions about the teams. This activity covers 1 variable statistics (mean, median, mode, range, standard deviation, box-and-whisker plot, histogram, two-way tables).This would be great as a partner activity or class activity.
Subjects:
Grades:
7th - 12th
Types:
CCSS:
Silence the Violence -- International Data Analysis - 21st Century Math Project
Silence the Violence intends to take a closer look at gun violence throughout the world. Is there a correlation between gun ownership and gun violence? While this is on the news, and people argue back and forth, unfortunately there are not a lot of statistics cited.I built this project through the use of correlations of authentic international data. I have included content for either middle school (plotting and calculating) or high school (calculating correlation with summations). The results ar
Subjects:
Grades:
6th - 12th
Types:
CCSS:
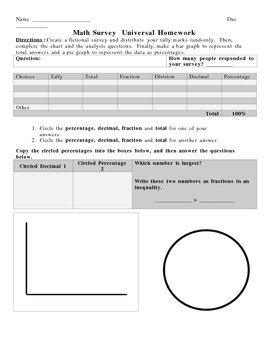
Take A Survey -- Learn Fractions, Percents and Decimals
This is a project that helps students learn to compute fractions, decimals and percents. The preview is a "universal" homework that students can complete for review any time during the year.
Take A Survey -- Learn Fractions, Percents and Decimals by Sherre Vernon is licensed under a Creative Commons Attribution-Share Alike 3.0 United States License.
Subjects:
Grades:
6th - 12th, Higher Education, Adult Education
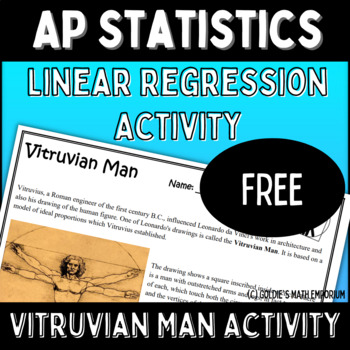
FREE AP Statistics Activity - Intro to Linear Regression
Introduction to Linear RegressionVitruvian Man ActivityThis is a FREE resource that I use to introduce linear regression in my AP Statistics and regular-level statistics course.There are two parts to the Vitruvian Man activity. The first part is the activity we complete together in class, and the second part is the homework assignment students take home to complete.In the first part, students gather the class's data on their height and their armspan. They plot the data and are taken through the
Subjects:
Grades:
10th - 12th
Types:
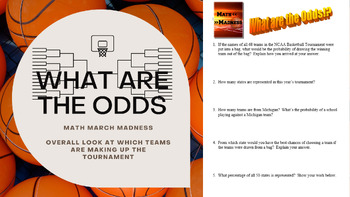
Math March Madness - What are the Odds!? (Overall Stats of Tournament Make Up)
Math + March Madness = Golden Learning Opportunities! Refocus those off topic conversations about march madness that come into the classroom into productive discussions from the math perspective! Students will be excited to work with this authentic, real world math application of probability and statistics. This assignment can be used after tourney teams are announced, but before all the action begins to research stats on teams that will be competing as well as answer a few probability questi
Subjects:
Grades:
6th - 12th, Higher Education
Types:
CCSS:
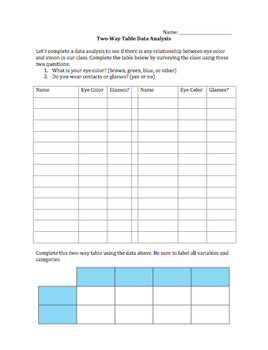
Two-Way Tables Data Collection and Analysis Activity
This product includes two different activities for using two-way tables to analyze a set of data and calculate relative frequencies. This is a good practice or summative assignment for this section. Students must already know how to calculate relative frequencies. The first two-way table activity involves surveying the class about their eye color and whether or not they wear glasses/contacts. The class can then turn the survey data into a two-way table and analyze it. In my class we did this one
Subjects:
Grades:
7th - 9th
Types:
CCSS:
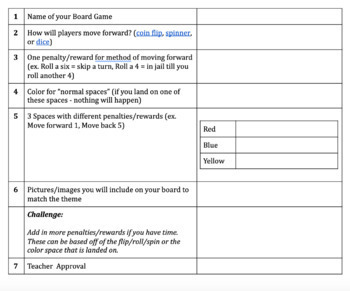
Board Game Probability Project
Students will create board games using JamBoard and explore using them together. They will discover different probabilities and compare their games to others. This is a fun student-centered project that can promote diversity through the different types of creations that students will make! The project is designed to last over 4 class periods but could be shortened or extended based on yours class!
Subjects:
Grades:
6th - 12th
Types:
CCSS:
- EXTRAIT - Le cycle d'une plante FRENCH SCIENCE ACTIVITY
Ce document est un extrait d'un document de 23 pages. L'extrait suivant contient 5 pages. Il porte sur le cycle d'une plante. Vous y trouverez deux pages avec des mots-étiquettes des étapes du cycle d'une plante ainsi qu'une évaluation en lien avec la notion.
CLIQUEZ ICI POUR ACCÉDER AU DOCUMENT ORIGINAL COMPLET.
Le document complet contient :
- la description du projet,
- les mots-étiquettes des étapes du cycle d'une plante,
- un cahier de l'élève de 11 pages (mise en situation, hypothèse,
Subjects:
Grades:
3rd - 4th
Types:
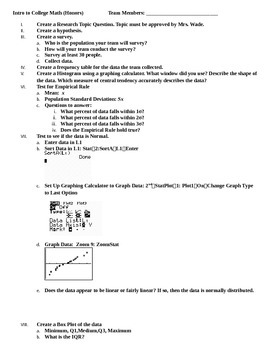
Statistics Project: Collecting & Interpreting Data
Students will create a survey topic, collect data. Students will create a histogram, box plot, check for normal distribution, use empirical rule and much more in this project. Students will do a presentation using power point, prezi, etc. Rubric included.
Subjects:
Grades:
9th - 12th
Types:
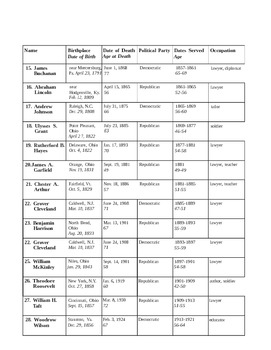
I Do Solemnly Swear...(Statistics Project)
This is a statistics project that can be modified to fit grades 6 to 12. This can also be done by hand or in excel. It would be a great assignment to use as a unit project or as a group presentation. It is a cross curriculum activity that will combine history and math together to give the kids a great way to explore box and whisker plots, bar graphs, pie charts, and more. Because this is statistics, you can change the way the graphs are created to fit the need of the course you are teaching!
Subjects:
Grades:
6th - 12th
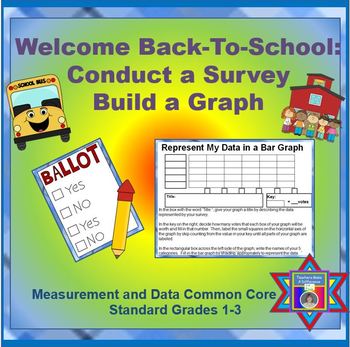
Graphs FREEBIE Back-To-School: Conduct a Survey & Build a Graph (CCSS Aligned)
FREE!!! FREE!!! FREE!!! FREE!!! FREE!!! FREE!!! FREE!!!
PLEASE take time to provide feedback in exchange for the download! I appreciate your time!
I created what I hope to be a fun but helpful resource for your students in Grades 1-3. In return, I ask that you please take time to rate and leave feedback to let others know how the activity worked for you and your students. I appreciate your time and effort!
In Grades 1-3, students are expected to be able to build their own bar
Grades:
1st - 3rd
Types:
CCSS Aligned Descriptive Statistics Survey Project
Freebie!!!
This project is a common core mathematics aligned Descriptive Statistics Survey Project. The project has been completed by a high school statistics class, but could be modified for lower grades. In this project students must create a survey, collect data from a group or sample population, analyze the data, create graphs and charts, and write a paper to explain their findings. I have also included a project topic submission form, a project rubric, and a student reflection form. Due
Subjects:
Grades:
8th - 11th
Types:
Da Vinci Project - Color by Number with Probability
Da Vinci Projects combine ingenuity, math, and art. Leonardo Da Vinci was one of the greatest minds that ever lived. He is famous for his art, but he was also one of the most prolific inventors and mathematicians of the Renaissance Era. Da Vinci Projects require students to create something wholly original, complete rigorous mathematics, and use art as a part of their creation or an example of their understanding.The purpose of this Da Vinci project is to allow students the opportunity to use cr
Subjects:
Grades:
6th - 8th
Types:
Also included in: Da Vinci Project – Color by Number with Math Bundle for 6th & 7th Grades
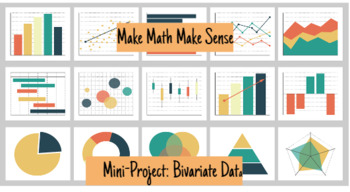
Bivariate Data Project: Height vs Shoe Size
A google slides activity that can aligns with ACOS and CCSS standards.This is a discovery based learning activity. Well suited for any middle school math classroom. Students will collect bivariate data from their classmates using a google form & google slides. They will then graph the data using a desmos graph and discuss the relationships they discover. CCSS.MATH.CONTENT.8.SP.A.1Construct and interpret scatter plots for bivariate measurement data to investigate patterns of association betwe
Subjects:
Grades:
7th - 8th
Types:
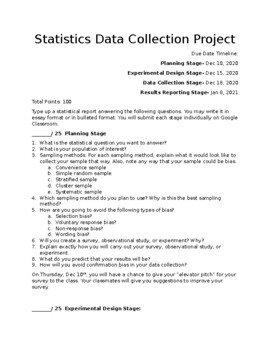
High School Statistics Data Collection Semester Project
This is file with instructions for a semester final project for students to take a survey, observational study, or experiment. This includes all instructions for students to complete this 2 to 3-week long assignment.
Subjects:
Grades:
8th - 12th, Higher Education
Types:
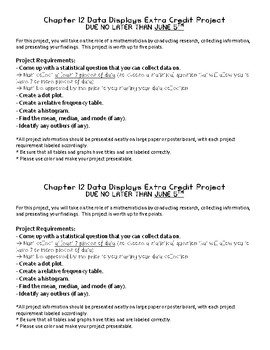
Probability Data Displays Project
This project was used as an extra credit project that ties in with chapter 12 of the 6th grade Go Math program. This project focuses on data displays, including dot plots, frequency tables, and histograms. This allowed students to create a statistical question, collect data, and present their findings. This product includes the directions sheet that I gave to my students, and then the students created posters that displayed the required information. There are two directions sheets per page i
Subjects:
Grades:
4th - 8th
Types:
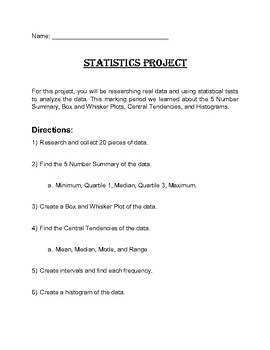
Statistics Project and Gallery Walk: Data, Box Plot, 5 Number Summary, Histogram
Need a summative assessment for your statistics class?This Statistics Project is a great way for students to show their knowledge of gathering and collecting data, calculating 5 Number Summary, creating Box and Whisker Plots, analyzing Central Tendencies, and graphing Histograms. Students can pick their own topic, create a poster of their data, and then present their findings to the class through a Gallery Walk.Example project is included.
Subjects:
Grades:
7th - 10th
Types:
Samples and Populations
This lesson will allow students to understand the concept of Samples and Populations. It has the content and videos which will provide students an engaging lesson. It also has links to an online survey that you as the teacher can conduct and control (This will need to be adapted to suit your specific class). Also included is question examples and activities for the students to engage with. The lesson goes through the following topics: samples, populations, surveys, census questionnaires and coll
Subjects:
Grades:
7th - 9th
CCSS:
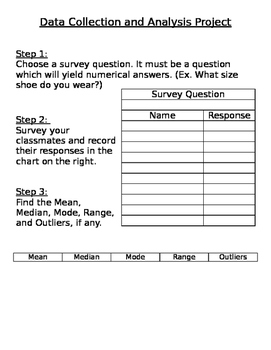
Survey Project
Students will create a survey question which yields numerical responses. They will have to find the mean, median, mode, range, outliers of the data. They will create a box-and-whisker plot, line plot, and find the mean absolute deviation of their data.
Subjects:
Grades:
6th - 8th
Types:
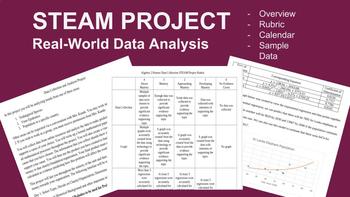
STEAM Project for High School Mathematics (Overview)
This project allows students to choose a topic to explore by collecting data and analyzing regressions to make predictions about future outcomes. This project is easily combined with other content areas. In fact, the Human Geography teacher, Biology teacher and English teachers are all creating extensions to my project to use in their course as a larger cross curricular project for the students. This is just the overview page of the project, however, you can also purchase the rubric I used and m
Subjects:
Grades:
8th - 12th
Types:
Showing 1-24 of 123 results


