139 results
Graphing handouts for Google Apps
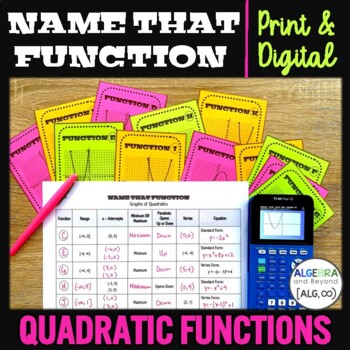
Graphing Quadratic Functions | Matching Review Activity | Practice Worksheets
Students make connections with functions and graphs in this Quadratic Functions matching activity. These print and digital practice worksheets include a fill-in-the blank table, with some information already given. Then, students match the quadratic graphs to the characteristics and fill in the missing information. This quadratic function review activity will have your students comparing and contrasting functions and graphs in a creative way.No prep – simply print or share digitally for an insta
Subjects:
Grades:
9th - 11th
Types:
CCSS:
Also included in: Quadratic Functions Review Activities Mini-Bundle | Graphing | Factoring
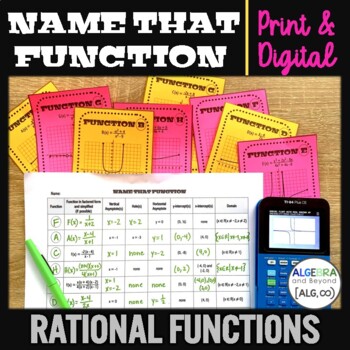
Graphing Rational Functions | Matching Review Activity | Practice Worksheets
Students make connections with functions and graphs in this Rational Functions matching activity. These print and digital practice worksheets include a fill-in-the blank table, with some information already given. Then, students match the graphs to the characteristics and fill in the missing information. This rational function review activity will have your students comparing and contrasting functions and graphs in a creative way. No prep – simply print or share digitally for an instant, interac
Subjects:
Grades:
10th - 12th
Types:
CCSS:
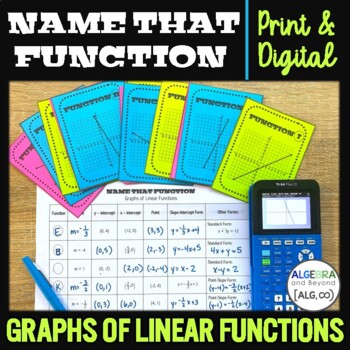
Graphing Linear Equations | Matching Review Activity | Linear Functions Practice
Students make connections with functions and graphs in this Linear Functions matching activity. These print and digital practice worksheets include a fill-in-the blank table, with some information already given. Then, students match the graphs to the characteristics and fill in the missing information. This linear functions review activity will have your students comparing and contrasting functions and graphs in a creative way. Also, includes a bonus version to analyze parallel and perpendicular
Subjects:
Grades:
8th - 10th
Types:
CCSS:
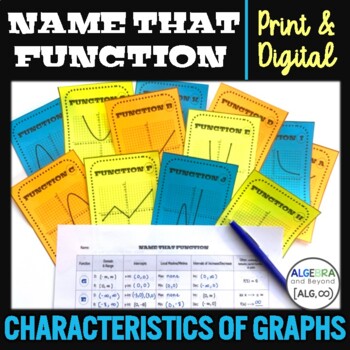
Identifying Parts of Functions and Graphs - Matching Activity | Print & Digital
Students make connections with functions and graphs in this Characteristics of Functions matching activity. These print and digital practice worksheets include a fill-in-the blank table, with some information already given. Then, students match the graphs to the characteristics and fill in the missing information. This identifying parts of functions review activity will have your students comparing and contrasting functions and graphs in a creative way.No prep – simply print or share digitally f
Subjects:
Grades:
9th - 12th
Types:
CCSS:
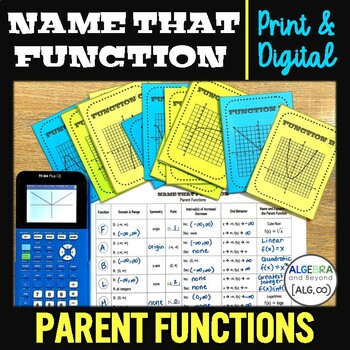
Identify Parent Functions | Graphing Activity | Linear, Quadratic, Exponential
Students make connections with functions and graphs in this Parent Functions matching activity. These print and digital practice worksheets include a fill-in-the blank table, with some information already given. Then, students match the graphs to the characteristics and fill in the missing information. This parent function review activity will have your students comparing and contrasting functions and graphs in a creative way.No prep – simply print or share digitally for an instant, interactive
Subjects:
Grades:
9th - 12th
Types:
CCSS:
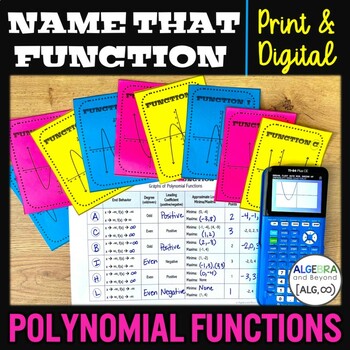
Graphing Polynomial Functions - Matching Review Activity | Print and Digital
Students make connections with functions and graphs in this Polynomial Functions matching activity. These print and digital practice worksheets include a fill-in-the blank table, with some information already given. Then, students match the graphs to the characteristics and fill in the missing information. This polynomial function review activity will have your students comparing and contrasting functions and graphs in a creative way.No prep – simply print or share digitally for an instant, inte
Subjects:
Grades:
9th - 11th
Types:
CCSS:
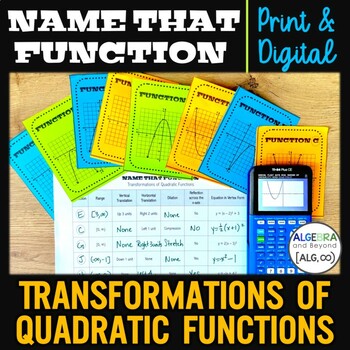
Graphing Quadratic Functions - Transformations, Vertex & Standard Form Activity
Students make connections with functions and graphs in this Transformations of Quadratic Functions matching activity. These print and digital practice worksheets include a fill-in-the blank table, with some information already given. Then, students match the graphs to the characteristics and fill in the missing information, including writing in vertex form and standard form. This quadratic function review activity will have your students comparing and contrasting functions and graphs in a creati
Subjects:
Grades:
9th - 11th
Types:
CCSS:
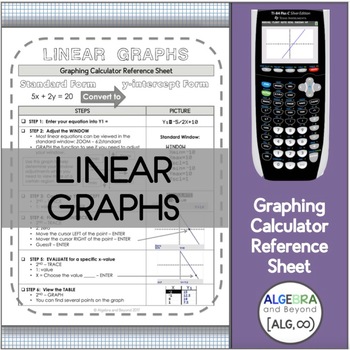
Graphing Linear Functions | TI-84 Calculator Reference Sheet and Practice
This graphing calculator reference sheet on linear graphs guides students step-by-step on how to set the window, find the x- and y- intercept, and view the table.INCLUDED:Reference Sheet: A reference page with step-by-step instructionsPractice Sheet: A practice page with four problems for students to review what they've learned.Digital Version: A Google Jamboard version is also included so students can practice these skills digitally.Teaching graphing calculator skills help students with: • Spee
Grades:
8th - 10th
Types:
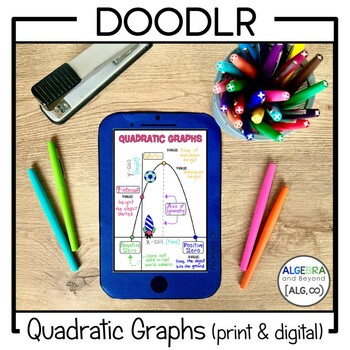
Quadratic Graphs - Doodlr
Doodlr is a spin on Tumblr. Students make connections with words and symbols through doodling. This activity includes a parabola graphic organizer for students to label in relation to real-world scenarios. Available in printable form and digital for Google Slides.Add more iMath activities to the phone throughout the year. This helps to show student growth and use for review at the end of the year.Please look at the preview to find out more information about this resource.∞∞∞∞∞∞∞∞∞∞∞∞∞∞∞∞∞∞∞∞∞∞∞∞
Grades:
8th - 10th
Types:
CCSS:
Also included in: Quadratic Functions Review Activities Mini-Bundle | Graphing | Factoring
Grade 6, Data Management, Graphing & Statistics (Unit 7)
The Grade 6 Math Program is designed to take the stress out of teaching! It is a fusion of traditional practice, coupled with modern teaching approaches to encourage authentic learning and deeper thinking.Each unit can be successfully executed individually, but were ideally designed to go in consecutive order for the year. Some concepts reappear in other units to encourage a holistic approach to mathematics. Algebra is intentionally woven throughout the entire Grade 8 Program to provide ample an
Subjects:
Grades:
5th - 7th
Types:
Also included in: Grade 6 Math Year with EDITABLE Assessments, Growing Bundle
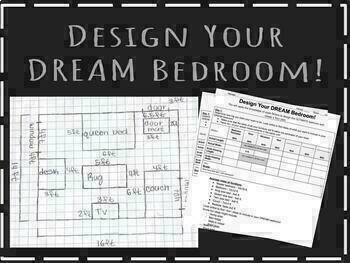
Fun Scale Drawing Project! (Minimal Prep)
Students will apply the knowledge of scale and scale factors to design their DREAM bedroom and create a floor plan! VERY MINIMAL PREP- all you have to do is print out the packets! Link for the project introduction Google slides included on the first page. Graph paper included on the third page.
Subjects:
Grades:
7th - 8th
Types:
CCSS:
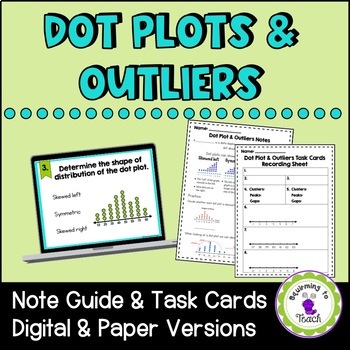
Dot Plots & Outliers Note Guide and Task Cards (Digital Option)
Do your students need some additional practice with dot plots and outliers? This resource is perfect for you! I have created a simple note guide for students to have as a reference. When done with the note guide they can work through some task cards on the concepts. These task cards can either be printed or done DIGITALLY! This resource includes:-Note guide -Note guide answers-15 task cards to print-Recording sheet for printable task cards-Link to digital slides to use through Google apps-Answer
Subjects:
Grades:
5th - 7th
Types:
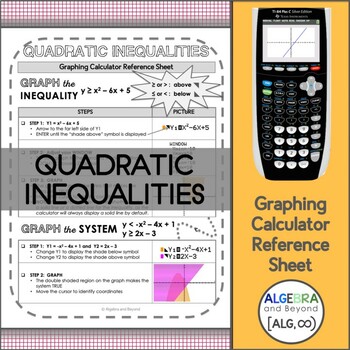
Quadratic Inequalities | TI-84 Graphing Calculator Reference Sheet and Practice
This graphing calculator reference sheet guides students step-by-step on how to graph a quadratic inequality and systems of quadratic to linear inequalities.INCLUDED:Reference Sheet: A reference page with step-by-step instructionsPractice Sheet: A practice page with four problems for students to review what they've learned.Digital Version: A Google Jamboard version is also included so students can practice these skills digitally.Teaching graphing calculator skills to help students with: • Speed•
Subjects:
Grades:
9th - 11th
Types:
CCSS:
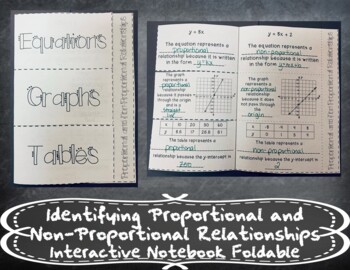
Idenitfying Proportional and Non-Proportional Relationships Foldable + Distance
Idenitfying Proportional and Non-Proportional Relationships FoldableTHIS FILE NOW CONTAINS THE PDF VERSION OF THIS PRODUCT PLUS A GOOGLE SLIDES VERSION FOR DISTANCE LEARNINGThis foldable covers identifying proportional and non-proportional relationships from equations, tables, and graphs. This product includes:- Pictures of the finished foldable in my INB- Step-by-step printing and folding instructions.- Link to mp4 Video Notes- Embedded Video Notes in Google Slides FileAnswer keys are included
Grades:
7th - 9th
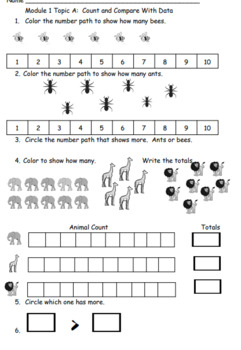
Eureka Math Squared Module 1 Topic A Quiz
This is an end of topic assessment for Eureka Math Squared Topic A: Count and compare with data. Students use graphs to organize, represent, and interpret data. They collect data by counting various things. They use the greater than > and less than < symbols to write comparisons number sentences.
Subjects:
Grades:
1st
Types:
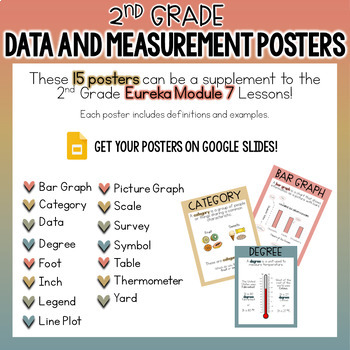
2nd Grade Posters - Data and Measurement - Eureka Module 7
These posters cover data and measurement vocabulary terms for 2nd grade.The terms in this pack areBar GraphCategoryDataDegreeFootInchLegendLine Plot Picture GraphScaleSurveySymbolTableThermometerYardThese posters can supplement the 2nd Grade Eureka Module 7 lessons.In this poster pack, you fill find posters for the vocabulary terms used in Module 7!There are 15 posters to print, laminate, and put on a bulletin board.You can also use these by printing them out and having students put them in thei
Subjects:
Grades:
1st - 3rd
Also included in: 2nd Grade Math Vocabulary and Strategy Posters
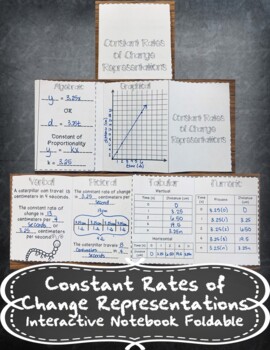
Constant Rates of Change Representations Foldable + Distance Learning
Constant Rates of Change Representations FoldableTHIS FILE NOW CONTAINS THE PDF VERSION OF THIS PRODUCT PLUS A GOOGLE SLIDES VERSION FOR DISTANCE LEARNINGThis foldable covers representing a Constant Rate of Change:- With a Graph- With a Table- Numerically- Verbally- Pictorally- AlgebraicallyThis product includes:- Pictures of the finished foldable in my INB- Step-by-step printing and folding instructions.- Link to mp4 Video Notes- Embedded Video Notes in Google Slides FileAnswer keys are include
Grades:
6th - 8th
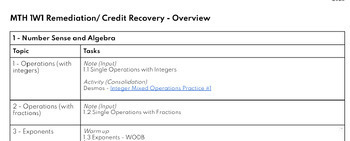
MTH 1W1 - Grade 9 Destreamed Math - Credit Recovery or Remediation
This course package contains notes that cover basic topics from the Ontario curriculum for Grade 9 Math. Split into three units (Number Sense and Algebra, Graphing and Linear Relations, and Measurement and Geometry). This material is at a very basic level, meant to fill gaps from previous learning, and support working towards moving into a grade 10 Ontario Math course. The notes can be used as whole-group learning (for remediation), or are used in a semi-guided format that students working in a
Subjects:
Grades:
8th - 10th

Graphing Using a Table of Values | Digital Activity and Worksheet
In this activity, students will practice filling in a table of values with integer points. They will graph each equation on the grid provided and determine which animal the line goes through. There are two versions of this activity, a basic worksheet and a Google Slides version. Questions: There are a total of 10 linear equations to graph using a table of values.-5 equations have an integer slope. -5 equations have a fractional slope. -The worksheet starts with 4 tables that have the x-values g
Grades:
6th - 11th
Types:
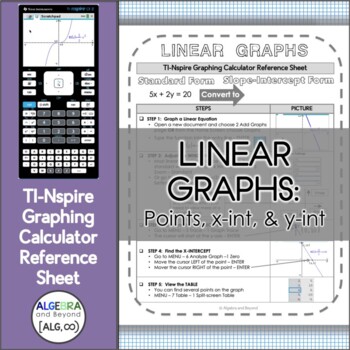
Graph Linear Equations | TI-Nspire Calculator Reference Sheet and Practice
This TI-Nspire graphing calculator reference sheet on linear graphs guides students step-by-step on how to set the window, find the x- and y- intercept, and view the table.INCLUDED:Reference Sheet: A reference page with step-by-step instructionsPractice Sheet: A practice page with four problems for students to review what they've learned.Digital Version: A Google Jamboard version is also included so students can practice these skills digitally.Teaching graphing calculator skills help students wi
Subjects:
Grades:
7th - 9th
Types:
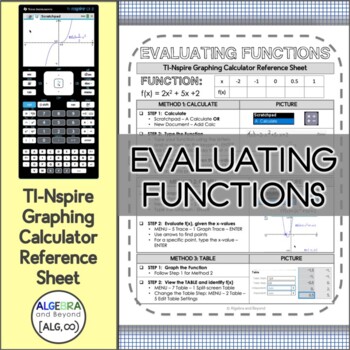
Evaluating Functions | TI-Nspire Calculator Reference Sheet and Practice
This TI-Nspire graphing calculator reference sheet on evaluating functions, guides students step-by-step on how to evaluate a function by calculating, graphing, and using the table.INCLUDED:Reference Sheet: A reference page with step-by-step instructionsPractice Sheet: A practice page with four problems for students to review what they've learned.Digital Version: A Google Jamboard version is also included so students can practice these skills digitally.Teaching graphing calculator skills help st
Subjects:
Grades:
8th - 10th
Types:
CCSS:
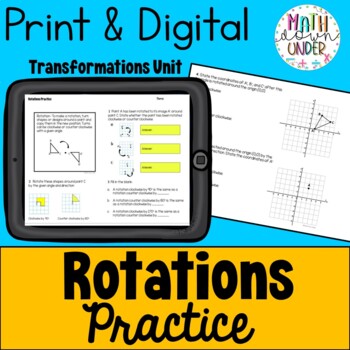
Transformations (Rotations) Practice Sheets - PDF & Digital
This resource includes 2 practice pages for Rotations as part of your Geometry Transformations unit. This resource includes a link to a digital, Google Slides version as well as a PDF for printing.Great for:ReviewMath CentersChoice BoardsHomeworkEarly finishersDistance learningCover LessonAdditional product information is viewable in the preview file. Answer Key included. Please follow my store and thank you for your support!
Grades:
7th - 9th
Types:
Also included in: Geometry Transformations MEGA Bundle - PDF & Digital
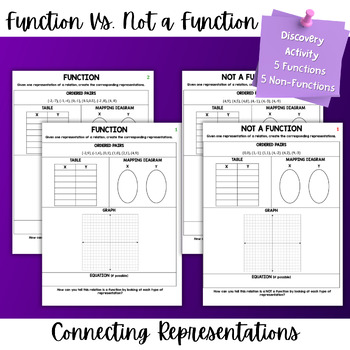
Function vs. Not a Function | Ordered Pairs, Table, Mapping Diagram, Graph
Function vs. Not a Function 5 Function Examples5 Non-Function Examples *Ordered Pairs are Editable Given a set or ordered pairs, students will create a table, mapping diagram, and a graph. Students will explore the different types of representations and make connections between the representation and whether the relation is a function or not. Students will create their own rules for determining if a relation is a function or not. How to Use this Activity in the Classroom:This can be used as an i
Grades:
8th - 11th
Types:
CCSS:
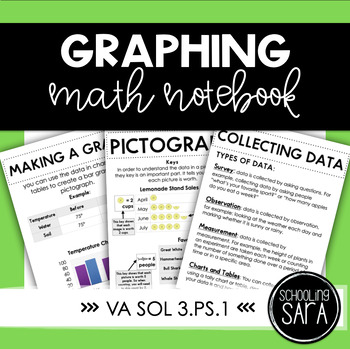
Graphing Math Interactive Notebook | Virginia SOL 3.15 | Digital & Print
This interactive notebook is geared towards Virginia SOL 3.15 which is graphing, with a focus on bar graphs and pictographs. It includes a digital version for paperless classrooms and instructor slides to aid in classroom instruction.Included in this interactive notebook are the following topics:vocabularycreating and reading a bar graphcreating and reading a pictographhow to collect datacreating and reading charts and tablestally charts and tally marksanswering questions about graphsLike what y
Grades:
3rd
Showing 1-24 of 139 results


