Scientific Method Variables and Graphing Practice
Jason Demers
72 Followers
Grade Levels
3rd - 12th
Subjects
Resource Type
Formats Included
- Word Document File
Pages
2 pages
Jason Demers
72 Followers
Description
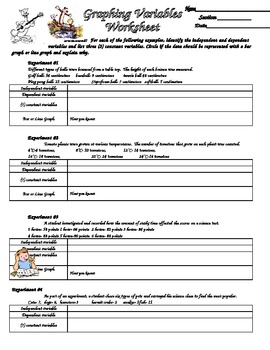
Students are given six different sets of experimental data and asked to identify the variables (independent, dependent etc.). They also reinforce graphing by identifying if the data should be represented with a bar or line graph. With this information, students the create data tables and graphs for the data.
Total Pages
2 pages
Answer Key
N/A
Teaching Duration
N/A
Report this resource to TPT
Reported resources will be reviewed by our team. Report this resource to let us know if this resource violates TPT’s content guidelines.


