43 results
Graphing handout images
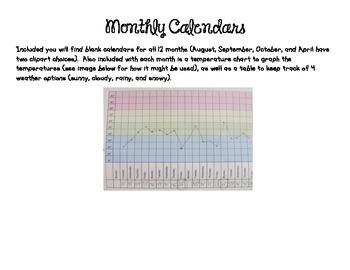
Blank Calendars and Weather Charts
Included you will find blank calendars for all 12 months (August, September, October, and April have two clipart choices). Also included with each month is a temperature chart to graph the temperatures, as well as a table to keep track of 4 weather options (sunny, cloudy, rainy, and snowy).
Clipart is from Scrappin' Doodles
Subjects:
Grades:
K - 4th, Staff
Types:
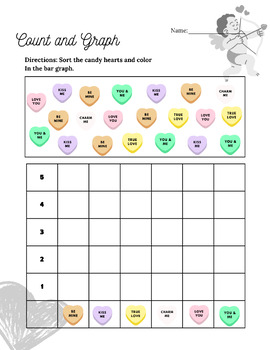
Valentines Day Graph NO PREP
Explore graphing effortlessly with this engaging holiday-themed activity designed for Kindergarten to 2nd graders. It's a no-prep, enjoyable way to dive into graphs and have some holiday fun while learning!~I would love to hear from you! Don't forget to leave a review~
Subjects:
Grades:
K - 2nd
Types:
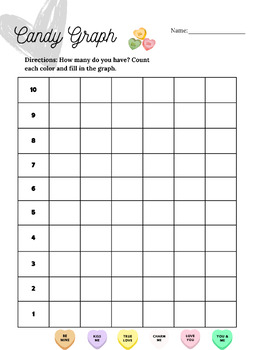
Valentines Day Candy Graph
Engage in a lively Valentine's Day Candy Hearts graphing activity—all you need is a bag of candy hearts! This interactive and enjoyable exercise offers simple yet effective graphing practice. It's an excellent way to illustrate graph variances using the same delightful product, fostering a deeper understanding among students.~I would love to hear from you! Don't forget to leave a review~
Subjects:
Grades:
K - 3rd
Types:
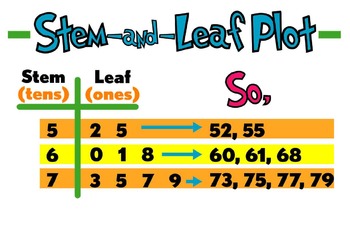
Stem and Leaf Plot Poster
This poster can serve as a great anchor chart for students learning about Stem and Leaf Plots. It is formatted to print out at 11x17 but you can reduce it down for students to paste into a journal.
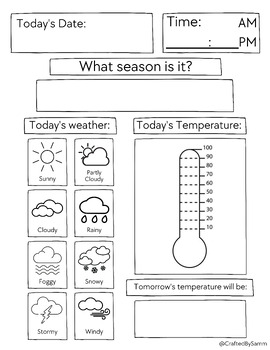
Today's Weather Worksheet
This worksheet is the perfect activity for your students to complete before jumping into your lesson on weather! Your students can track the date, time, season, weather, temperature and tomorrows weather! Perfect for Elementary or Special Education!Students will learn how to research the weather for tomorrow and use a thermometer to graph the temperature.You can either bring your students outside with this worksheet or pull up a weather website so they can use that as a reference!!
Subjects:
Grades:
2nd - 5th
Types:
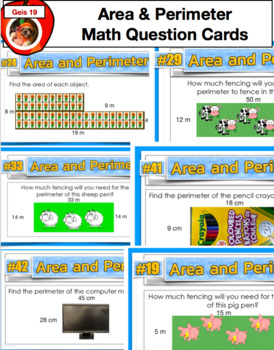
Grade 3 Math Bundle - Money, Data Management, Fractions, Measurement
CHECK OUT MY OVER 200 FANTASTIC TPT RESOURCES @:https://www.teacherspayteachers.com/Store/Geis19Grade 3 Math BundleA one stop shop. An excellent value for the amount of content available. No Prep! Just print and go! Covers many math strands for your students.1. Money2. Data Management - Pictographs, Bar Graphs, etc.3. Area and Perimeter4. Practice Questions5. Angles - Using a Protractor6. Fractions7. Problem Solving8. Multiplication9. Measurement10. Smart board Trivia11. Comparing NumbersCHEC
Subjects:
Grades:
2nd - 4th
Types:
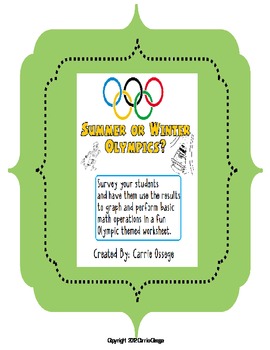
Olympics Math Worksheet
This is fun Olympics themed worksheet that can be used to survey your students responses to the question "Do you like the Summer or Winter Olympics?". Students will answer on a chart paper graph or poster board setup by the teacher. Students will use the results of the survey to graph their responses and perform basic math operations such as addition, subtraction, fact families, and estimating. It can also be used as a fun way to introduce an Olympics-themed unit.
Olympics Math Worksheet by Carr
Subjects:
Grades:
1st - 5th
Types:
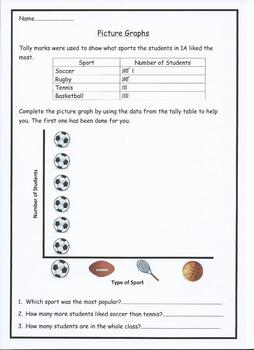
Picture Graphs
Introduction to unit on Data this handout explores picture graphs and the use of tally mark for stage 1 students. Students learn to read a tally table, draw their own picture graph and answer questions relating to the data presented.
Subjects:
Grades:
1st - 2nd
Types:
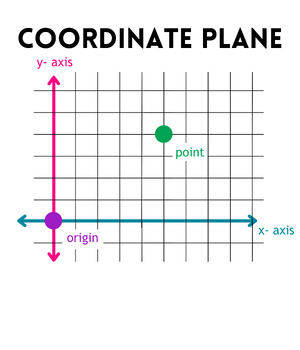
Basic Coordinate Plane
Basic Coordinate Planebasic coordinate plane ft. color differentiated x-axis, y-axis, point, and origin
Subjects:
Grades:
Not Grade Specific
Also included in: Basics Bundle

So, You Have to do a Science Fair: A Collection of Resources
Do you have a science fair coming up? You want your kids to do more than copy a ‘trick’ experiment from the Internet, right? You want them to choose experiments that have substance? The science fair is broken down into three sections:The experimentThe backboardThe presentationTips are provided for each section. They include how to do charts and graphs, how to do an attractive backboard and how to prepare for the presentation....even possible questions judges may ask.Included is the following:Mem
Subjects:
Grades:
3rd - 8th
Types:
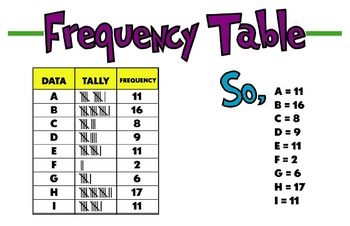
Frequency Table Poster
This poster can serve as a great anchor chart for students learning about Frequency Tables. It is formatted to print out at 11x17 but you can reduce it down for students to paste into a journal.
Subjects:
Grades:
3rd - 8th
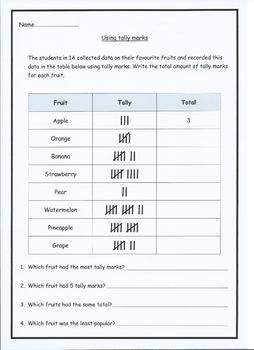
Data Tally Tables
This printable is a great resource to use for teaching stage 1 students about how to use tally marks and record given data appropriately. This sheet requires students to read and create tally tables and should be used alongside Data Tally Tables pt.2.
Subjects:
Grades:
1st - 2nd
Types:
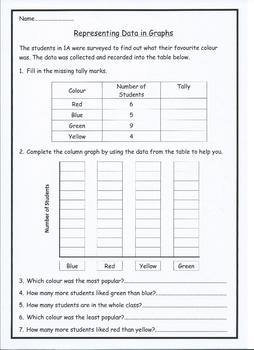
Representing Data pt.1
This printable provides a great resource for use with stage 1 students, students are required to read, interpret and create graphs using data provided. This printable should be used alongside Representing Data pt.2.
Subjects:
Grades:
1st - 2nd
Types:
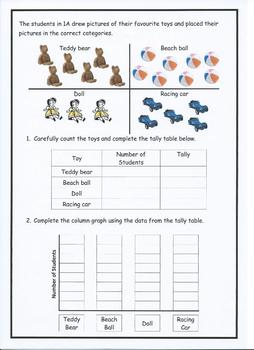
Representing Data pt.2
This printable allows students to explore the topic of Data by allowing them to read, interpret and create tally tables and graphs using information provided. This printable should be used alongside Representing Data pt.1.
Subjects:
Grades:
1st - 2nd
Types:
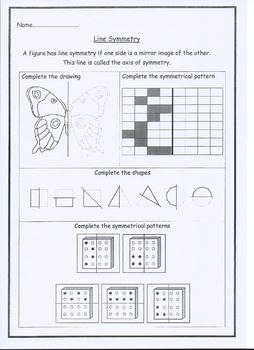
Line Symmetry
This handout can be used as a resource to help students develop their understanding of line symmetry. Students are required to identify line symmetry through various tasks including drawing and completing symmetrical patterns.
Subjects:
Grades:
2nd - 4th
Types:
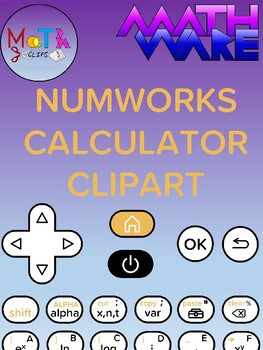
Numworks Graphing Calculator Keys Clipart
86 high quality images of Numworks graphing calculator keys. In color and b/w lineart. There is also clipart with just the whole keypad in color and b/w. All 43 individual calculator keys are also included in color and b/w. All images are crisp PNG images and scalable to to any size. B/W lineart images have a transparent background.You may use in any personal or commercial product as long as the image is protected. If used in a commercial product please give me credit by displaying my logo on yo
Subjects:
Grades:
9th - 12th, Higher Education
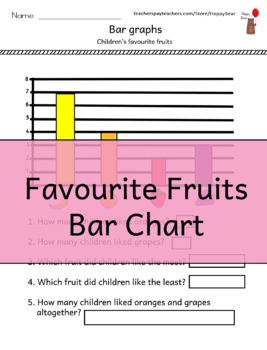
Favourite Fruit Bar Chart Math
This bar chart activity involves finding out how many children like each different fruit. The question tasks go a step further, targeting the students' understanding of 'most' and 'least', as well as a simple addition task.
Subjects:
Grades:
1st - 2nd
Types:
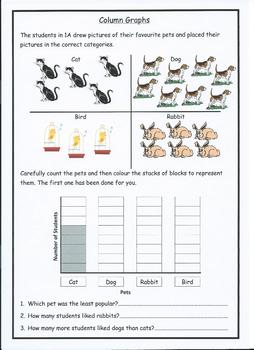
Column Graphs Data
Introduction to unit on Data this handout explores column graphs and requires students to convert given data into a column graph. Students learn to create column graphs and answer questions relating to the data presented.
Subjects:
Grades:
1st - 2nd
Types:
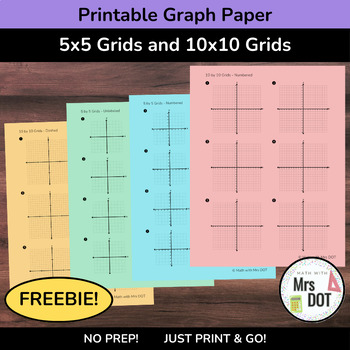
*FREEBIE* Printable Graph Paper with 5x5 Grid and 10x10 Grid - Sheets
Explore the realms of math and creativity with our "Printable Graph Paper with 5x5 Grid and 10x10 Grid - Classroom Ready Sheets," tailored for educators, students, and enthusiasts alike. This pack is brimming with printable graph papers that feature both 5x5 and 10x10 grids, catering to a variety of complexity and precision needs.Whether you prefer the clean lines of unnumbered axes for a minimalist approach or the clarity of numbered scales for precise plotting, this bundle has you covered. It
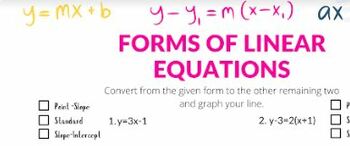
Graphing Forms of Linear Equations
Students will select and create a graph based on the equation provided. The final question wants students to find the equation of the line (1, 2, 3) in any form. This question can also be a preview or review of parallel and perpendicular lines.
Grades:
8th - 10th
Types:
CCSS:
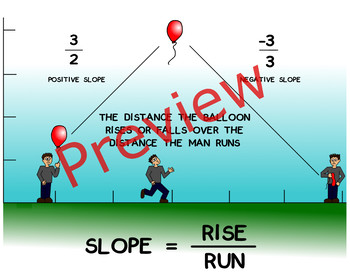
Slope Using A Balloon Poster
This poster illustrates positive and negative slope using a balloon and a man running. The formula for slope is given along with a text description using the illustration. A positive slope is shown as the balloon rises and then a negative slope is shown when the balloon pops and falls back down.
You are paying for the file which can be printed on a sheet of paper or taken to a copy shop to be enlarged up to a 16" by 20" poster.
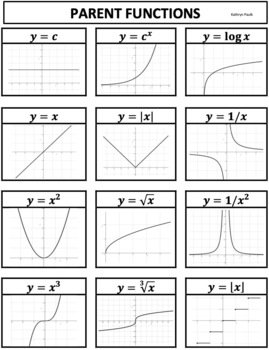
Parent Functions (JPG)
Parent Functions -- Equations and Graphs
Subjects:
Grades:
6th - 12th, Adult Education
Types:
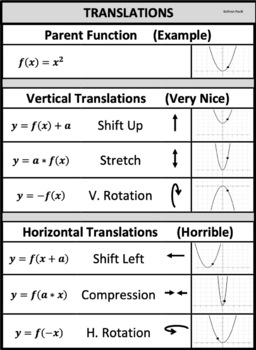
Translations (JPG)
Vertical and Horizontal Translations of Functions.
Subjects:
Grades:
6th - 12th, Adult Education
Types:
Showing 1-24 of 43 results


